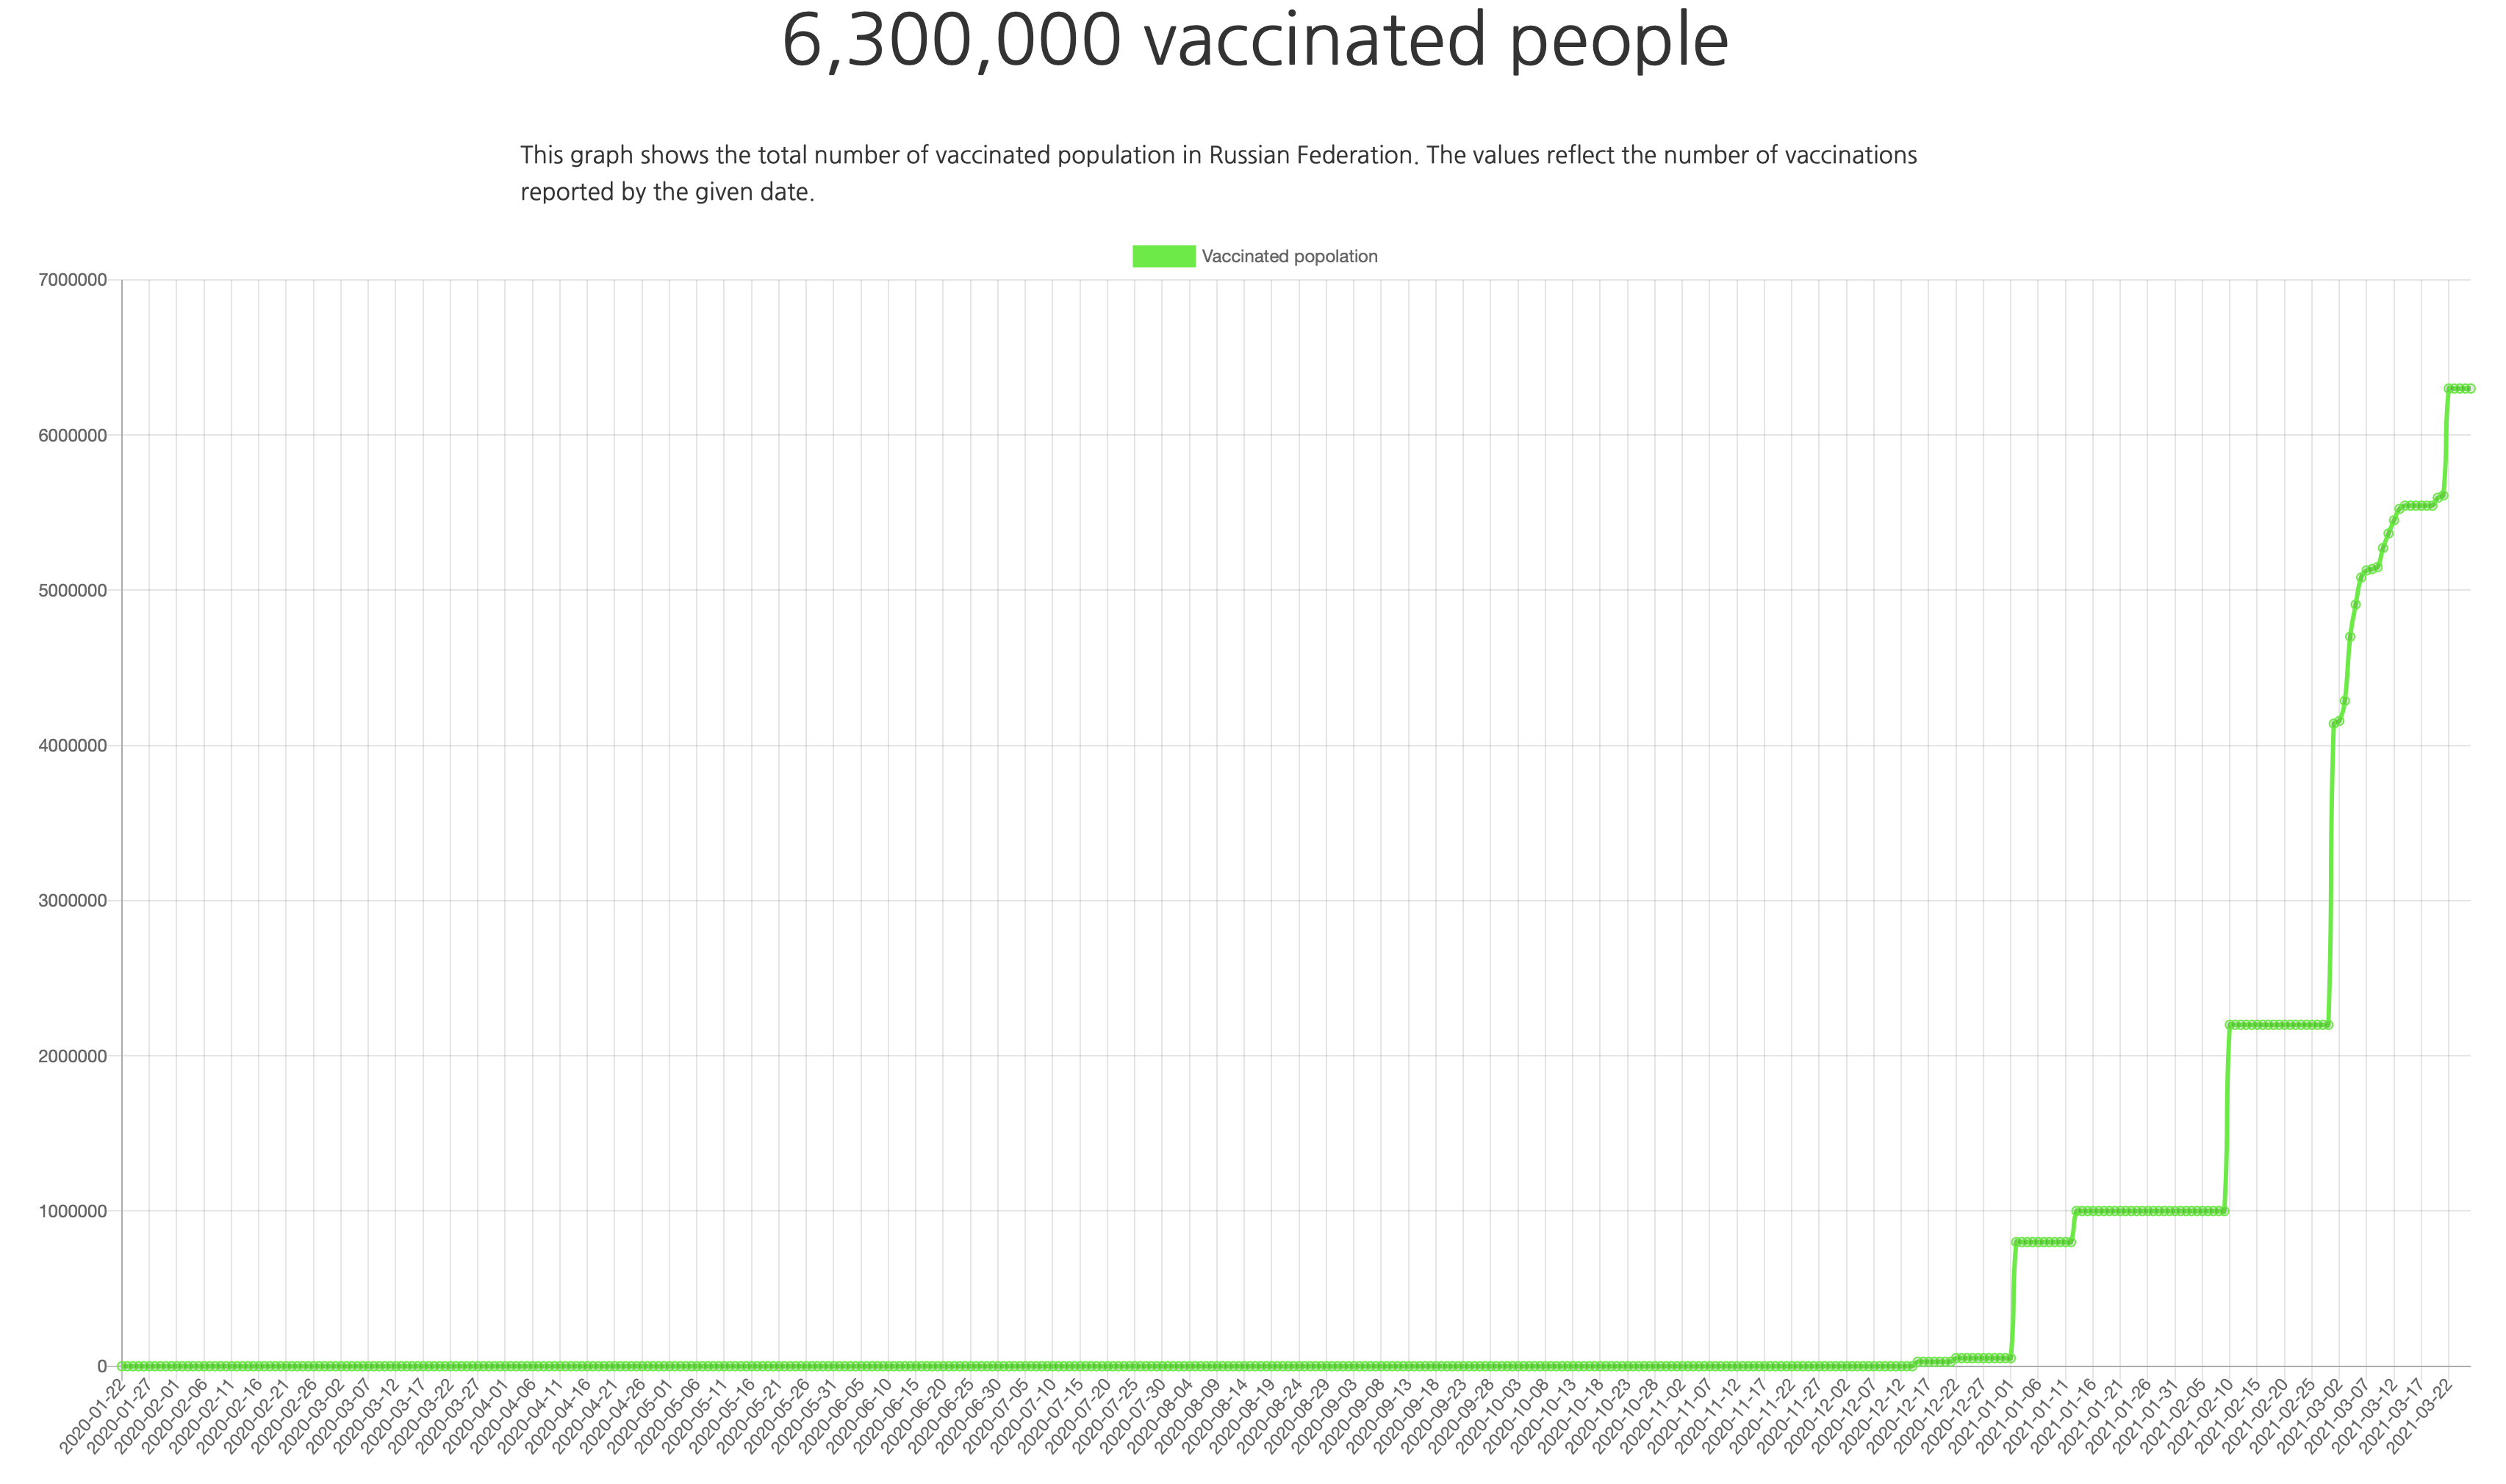
March 26, 2021
Vaccination data added to country pages where possible.
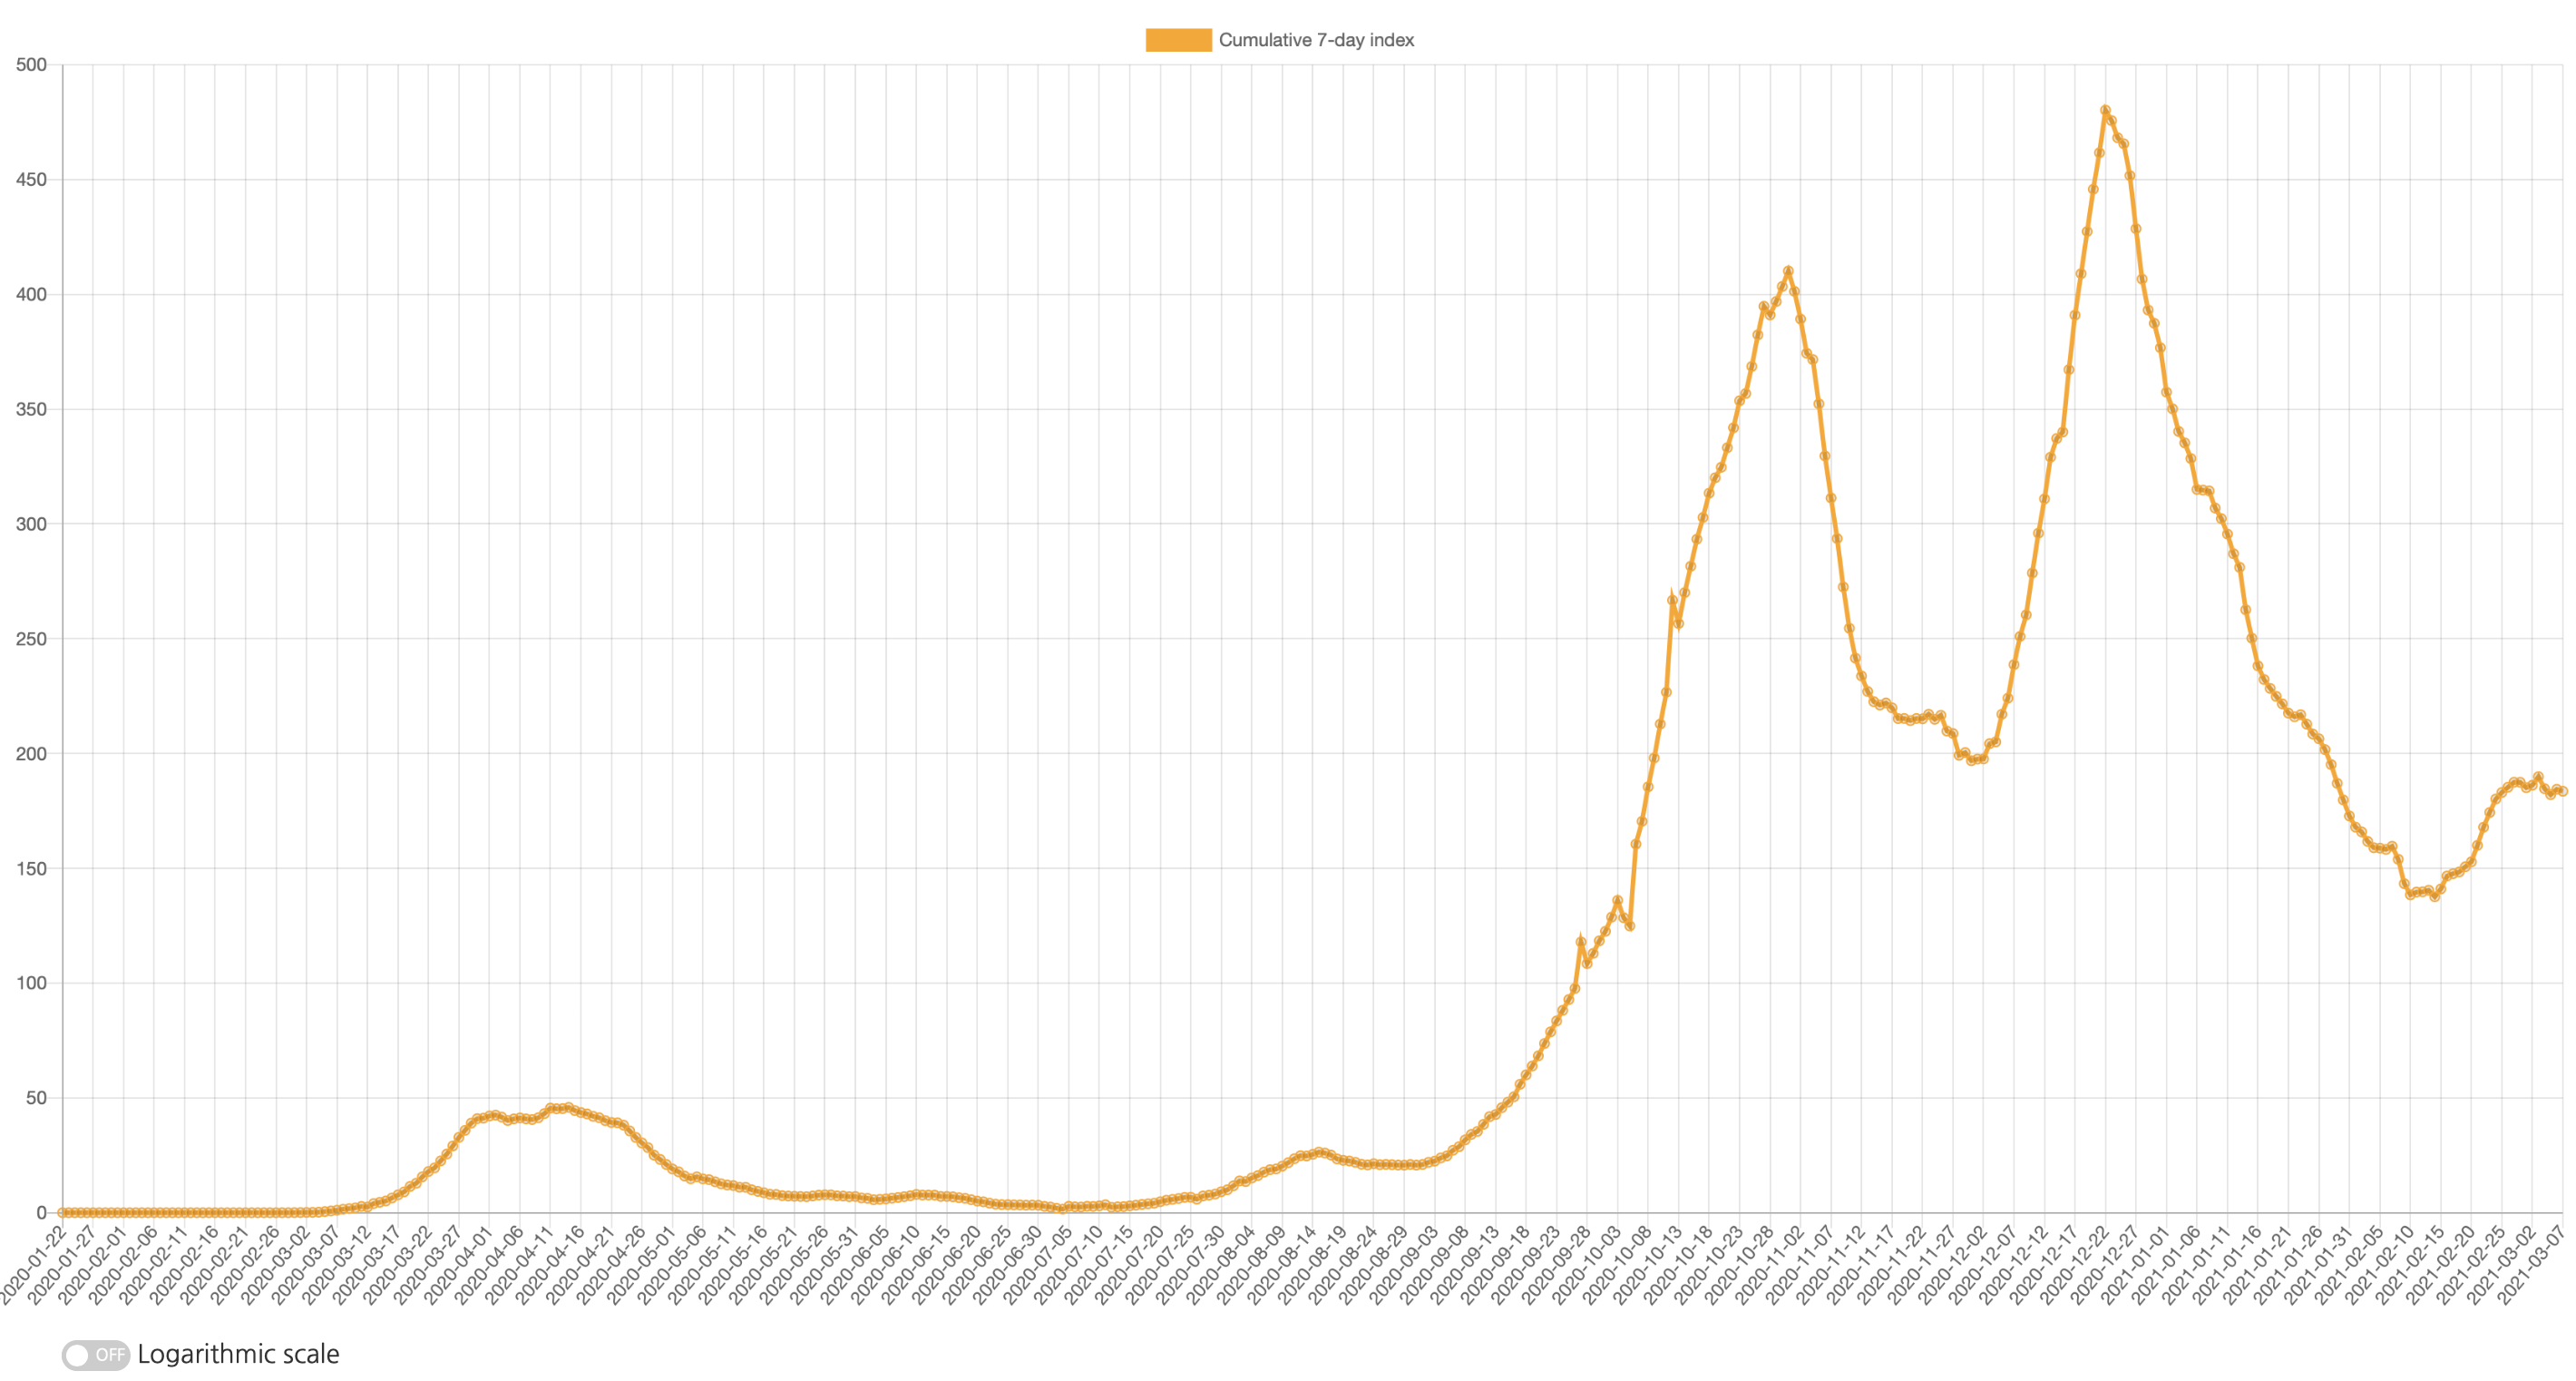
March 8, 2021
The 7-day cumulative index has been added to accomplish the 14-days index. This graph shows the number of new confirmed cases found during the last 7 days per every 100.000 people in the given country or region.
August 2, 2020
The new graph added to the site: the graph displaying the cumulative 14-day index. For the given country, it is reflecting the number of new confirmed cases, which appeared during the last 14 days. For example, here is the graph for the Netherlands:
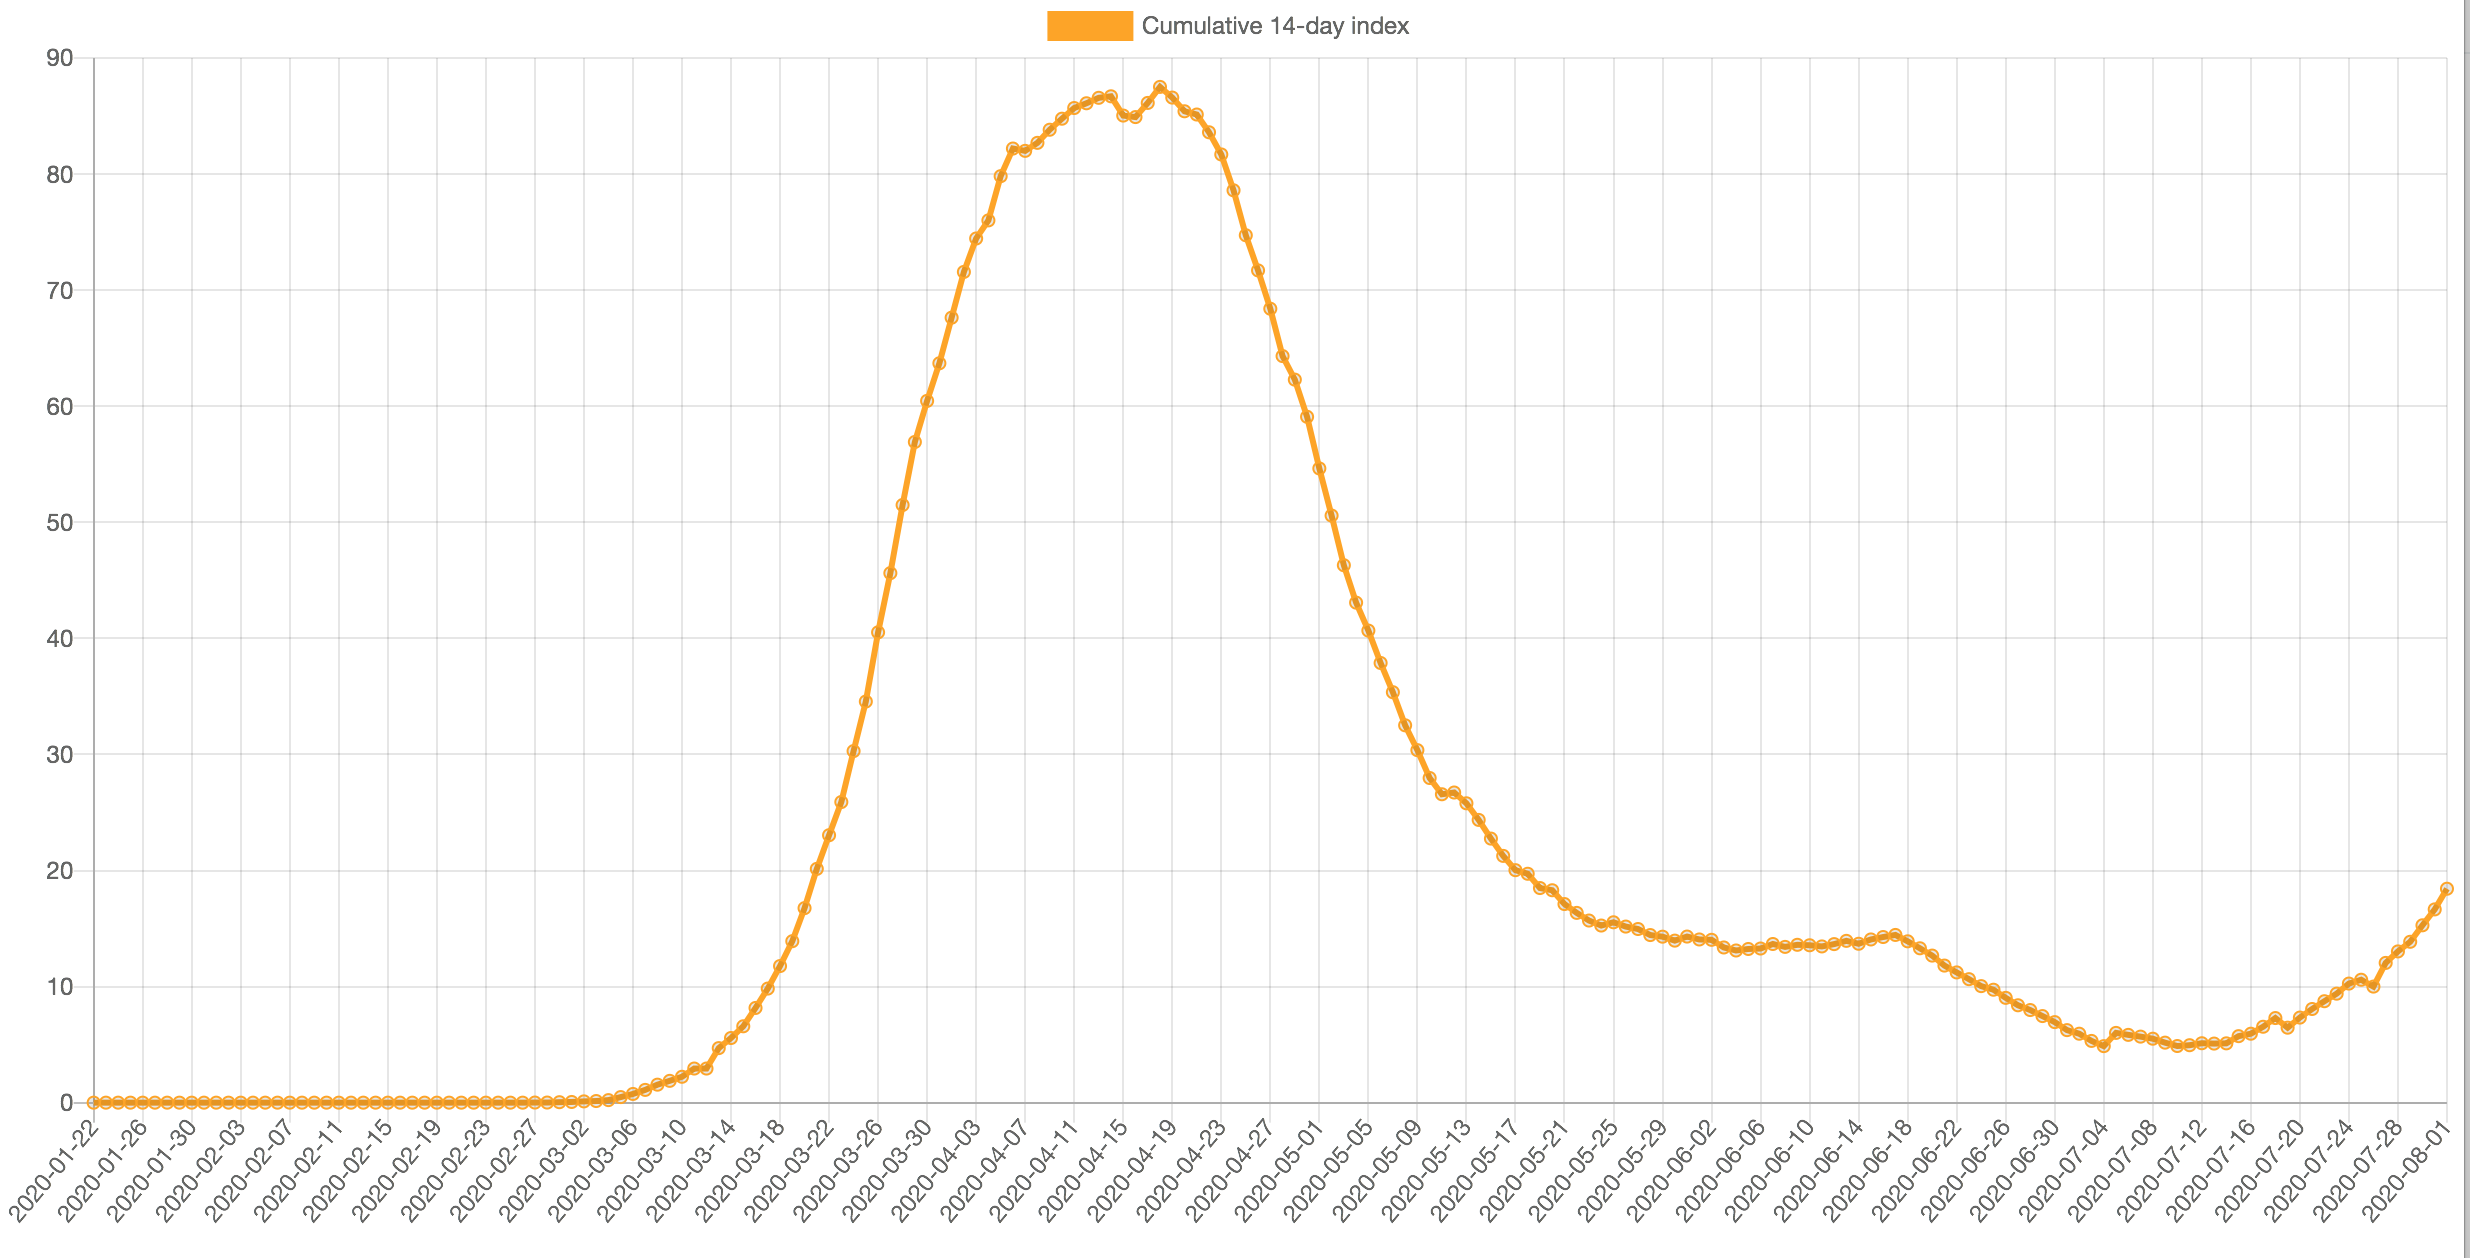
Some countries use such data to estimate the need of self-isolation for the foreign tourists arriving to the country. For example, here is the weekly updated data from Latvia’s Disease Control and Prevention Center.
May 21, 2020
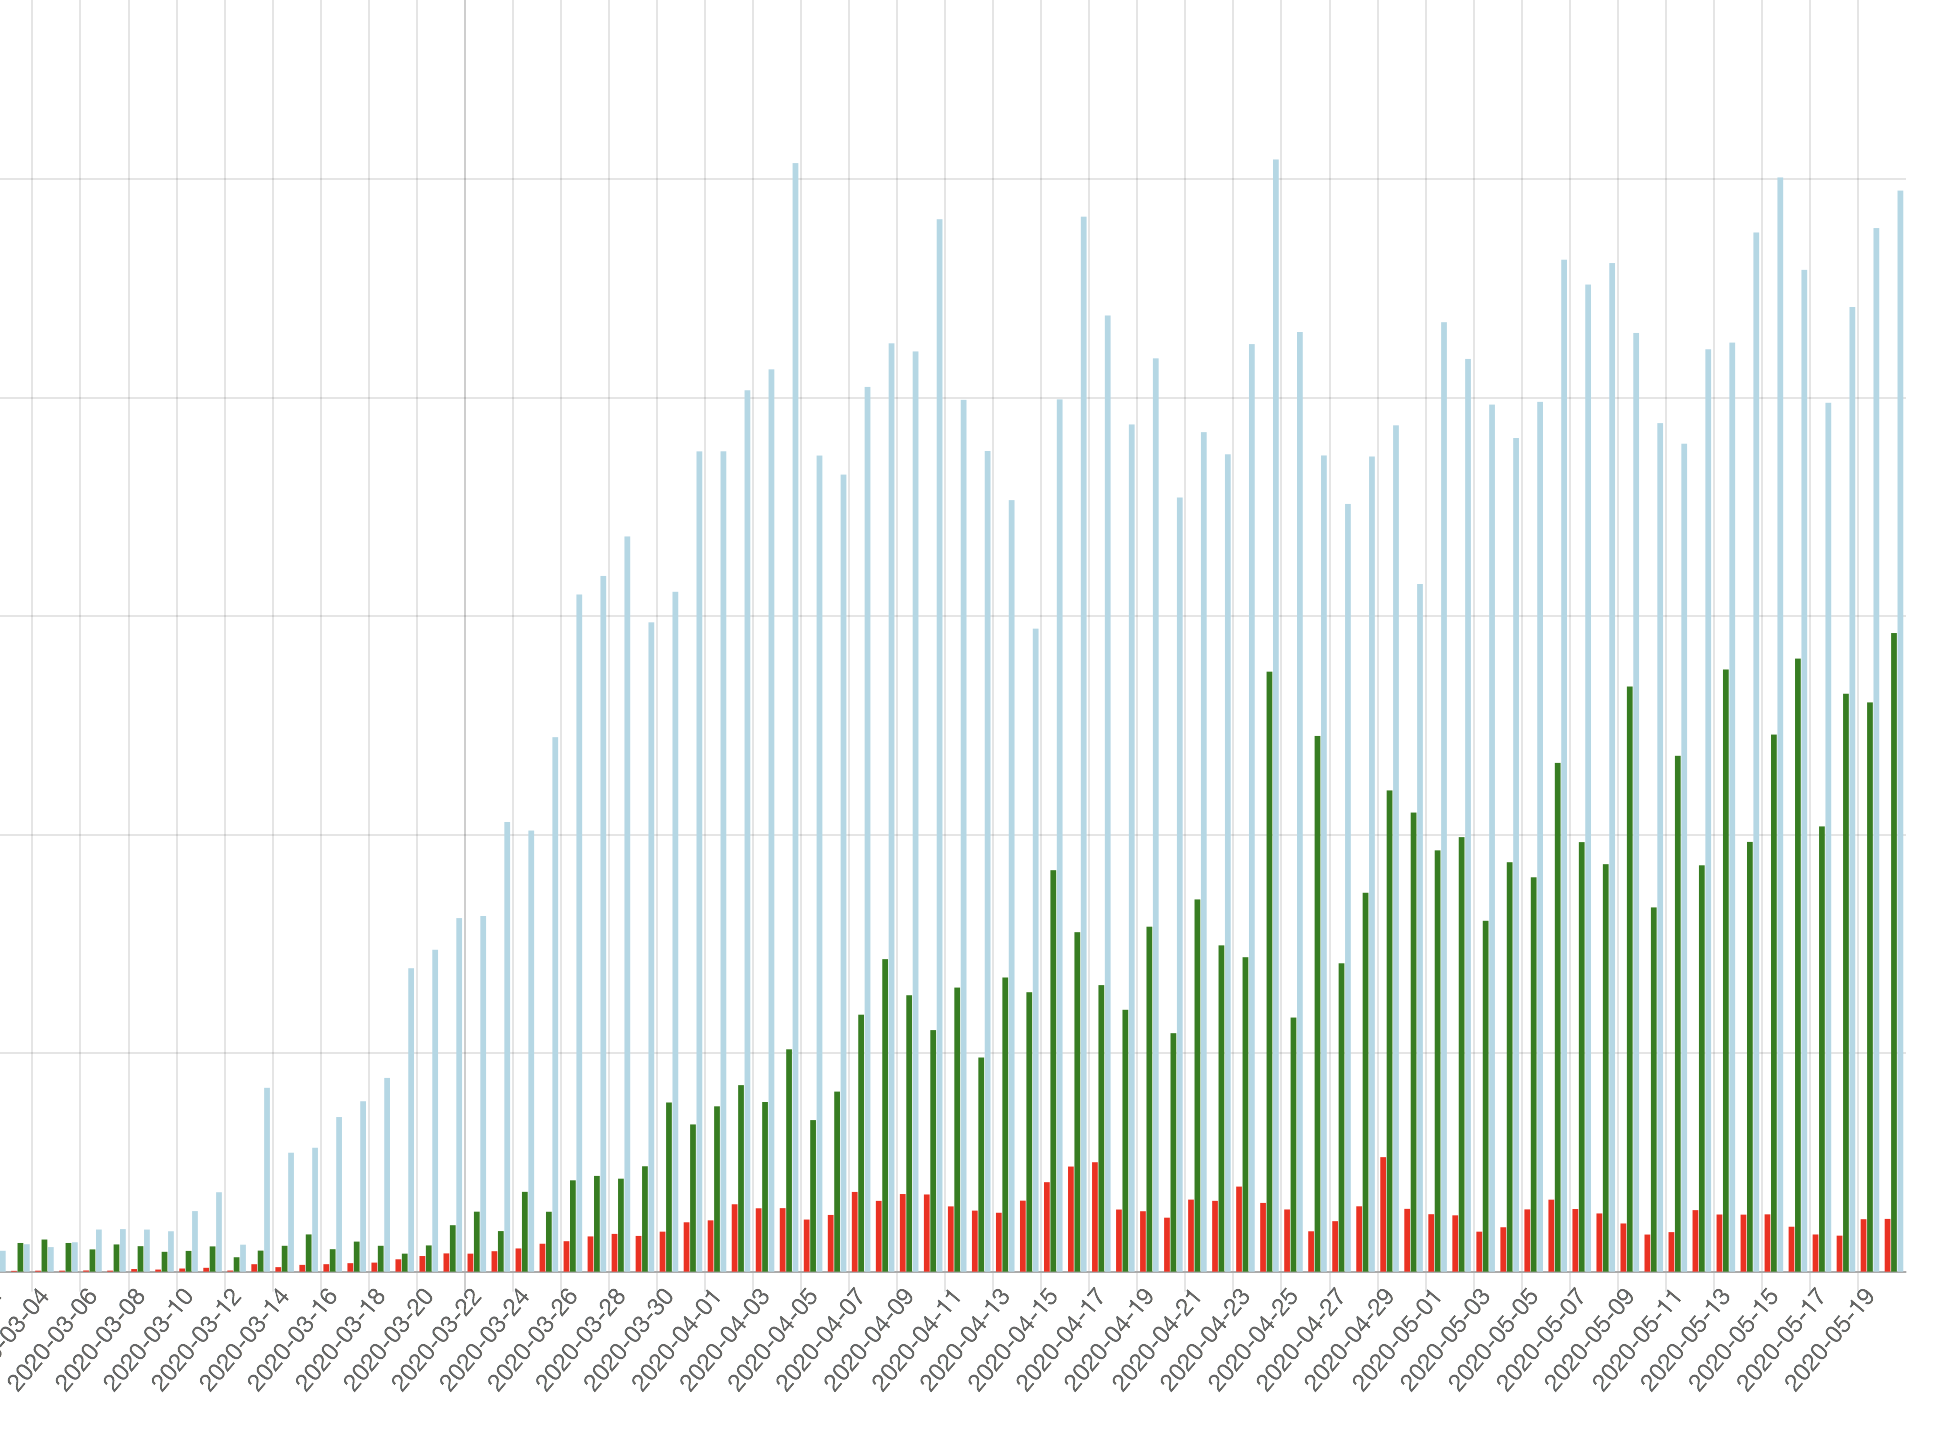
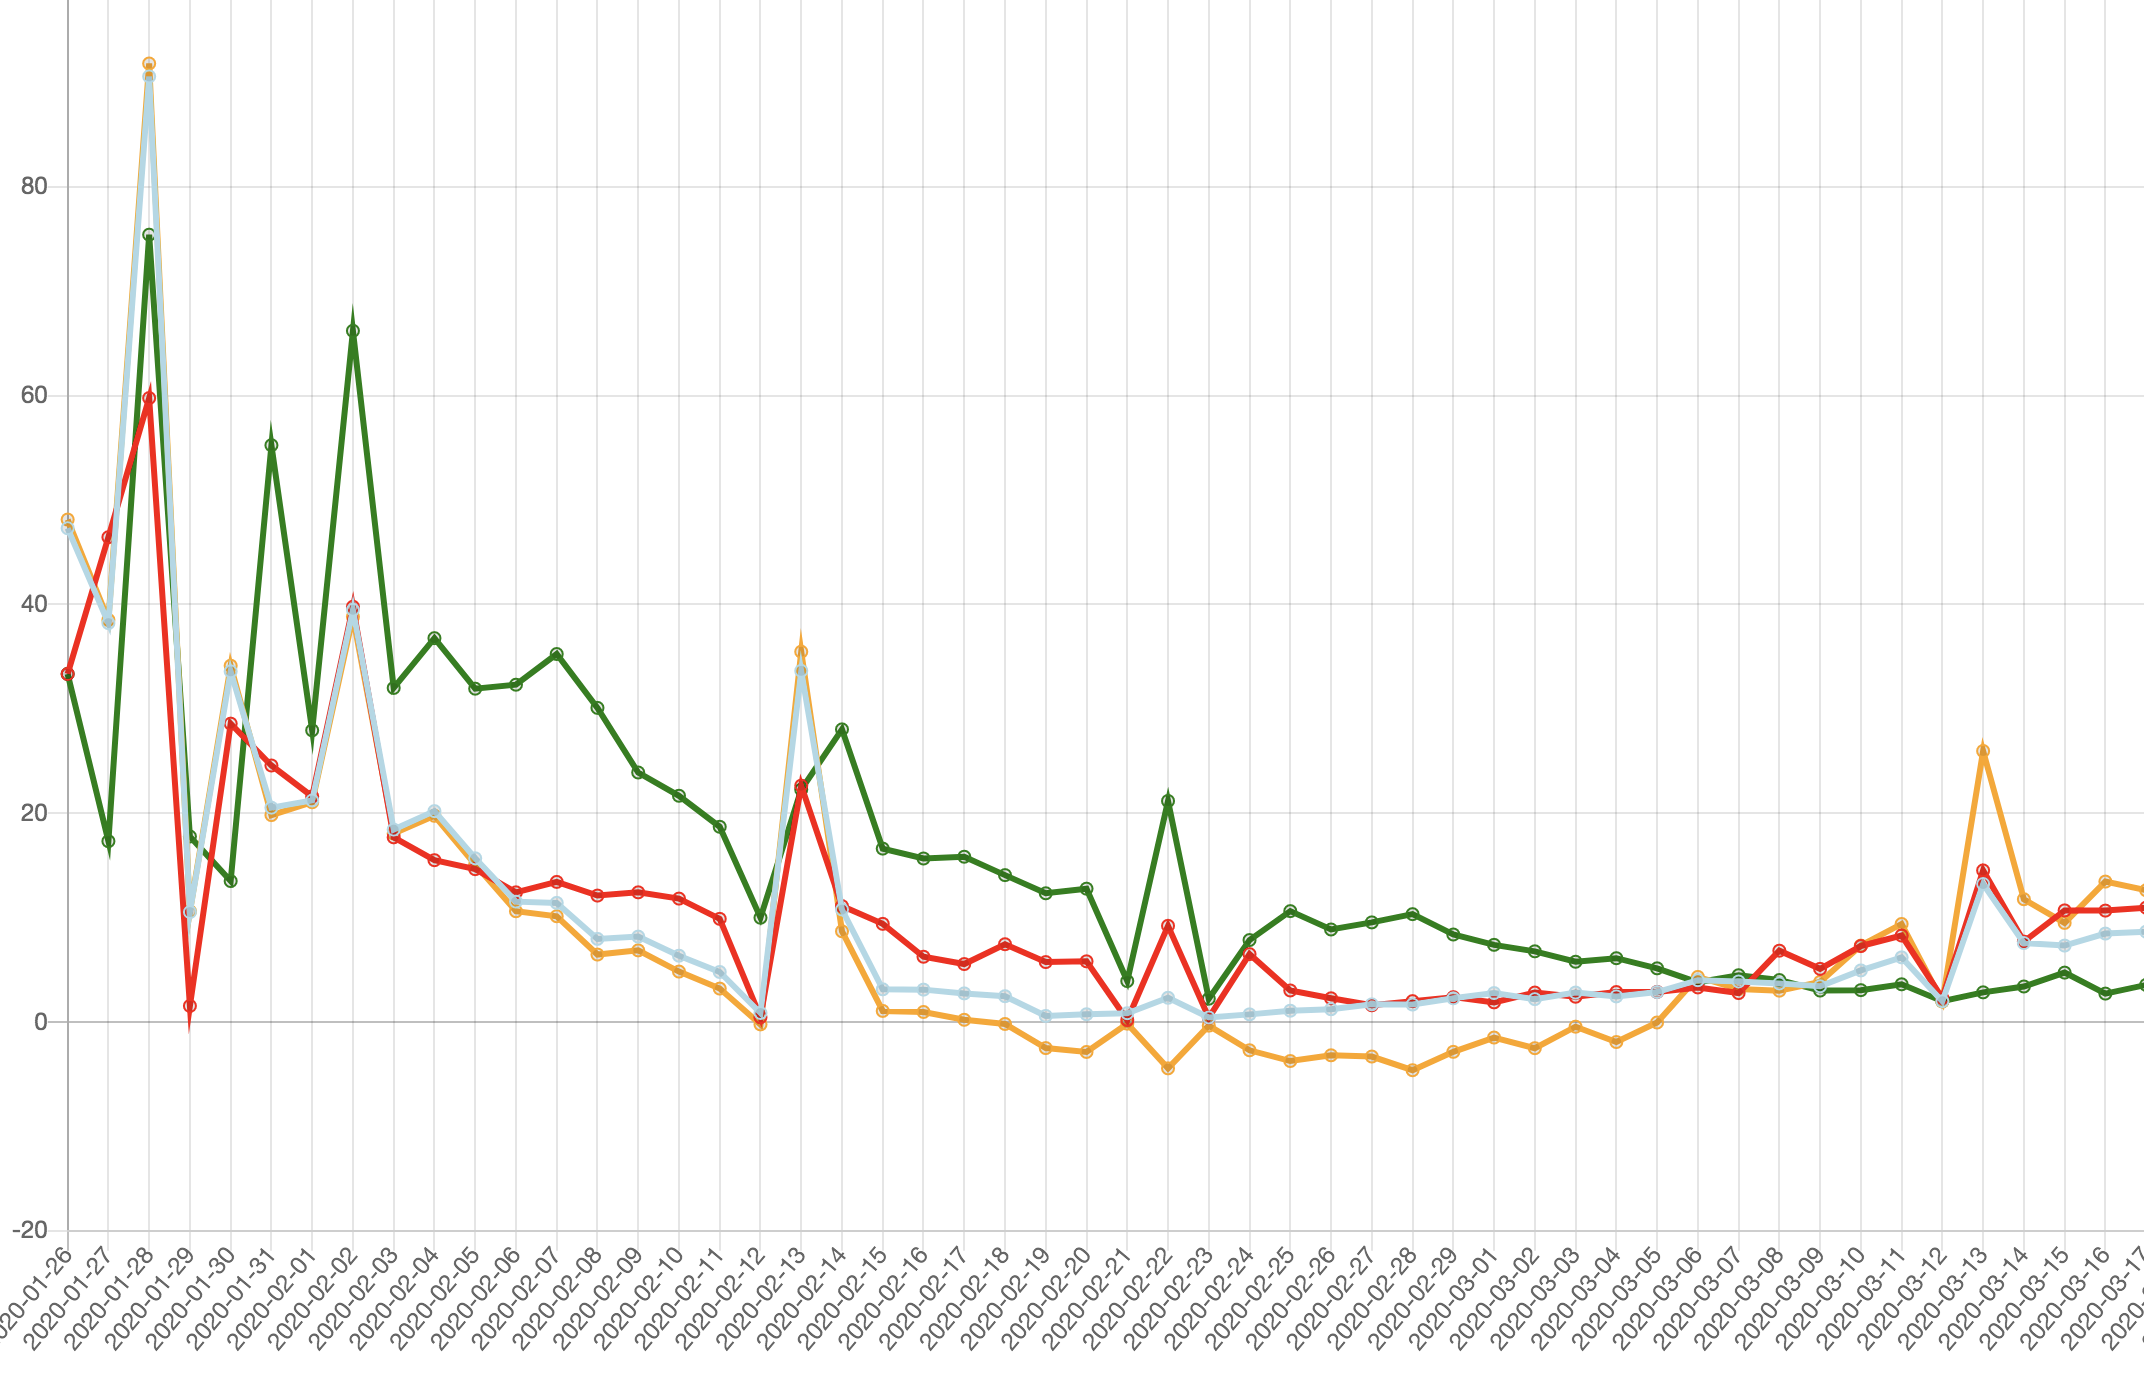
A new graph added to the site: the timeline reflecting the contribution of new coronavirus infections that are added to the world statistics by the most affected countries.
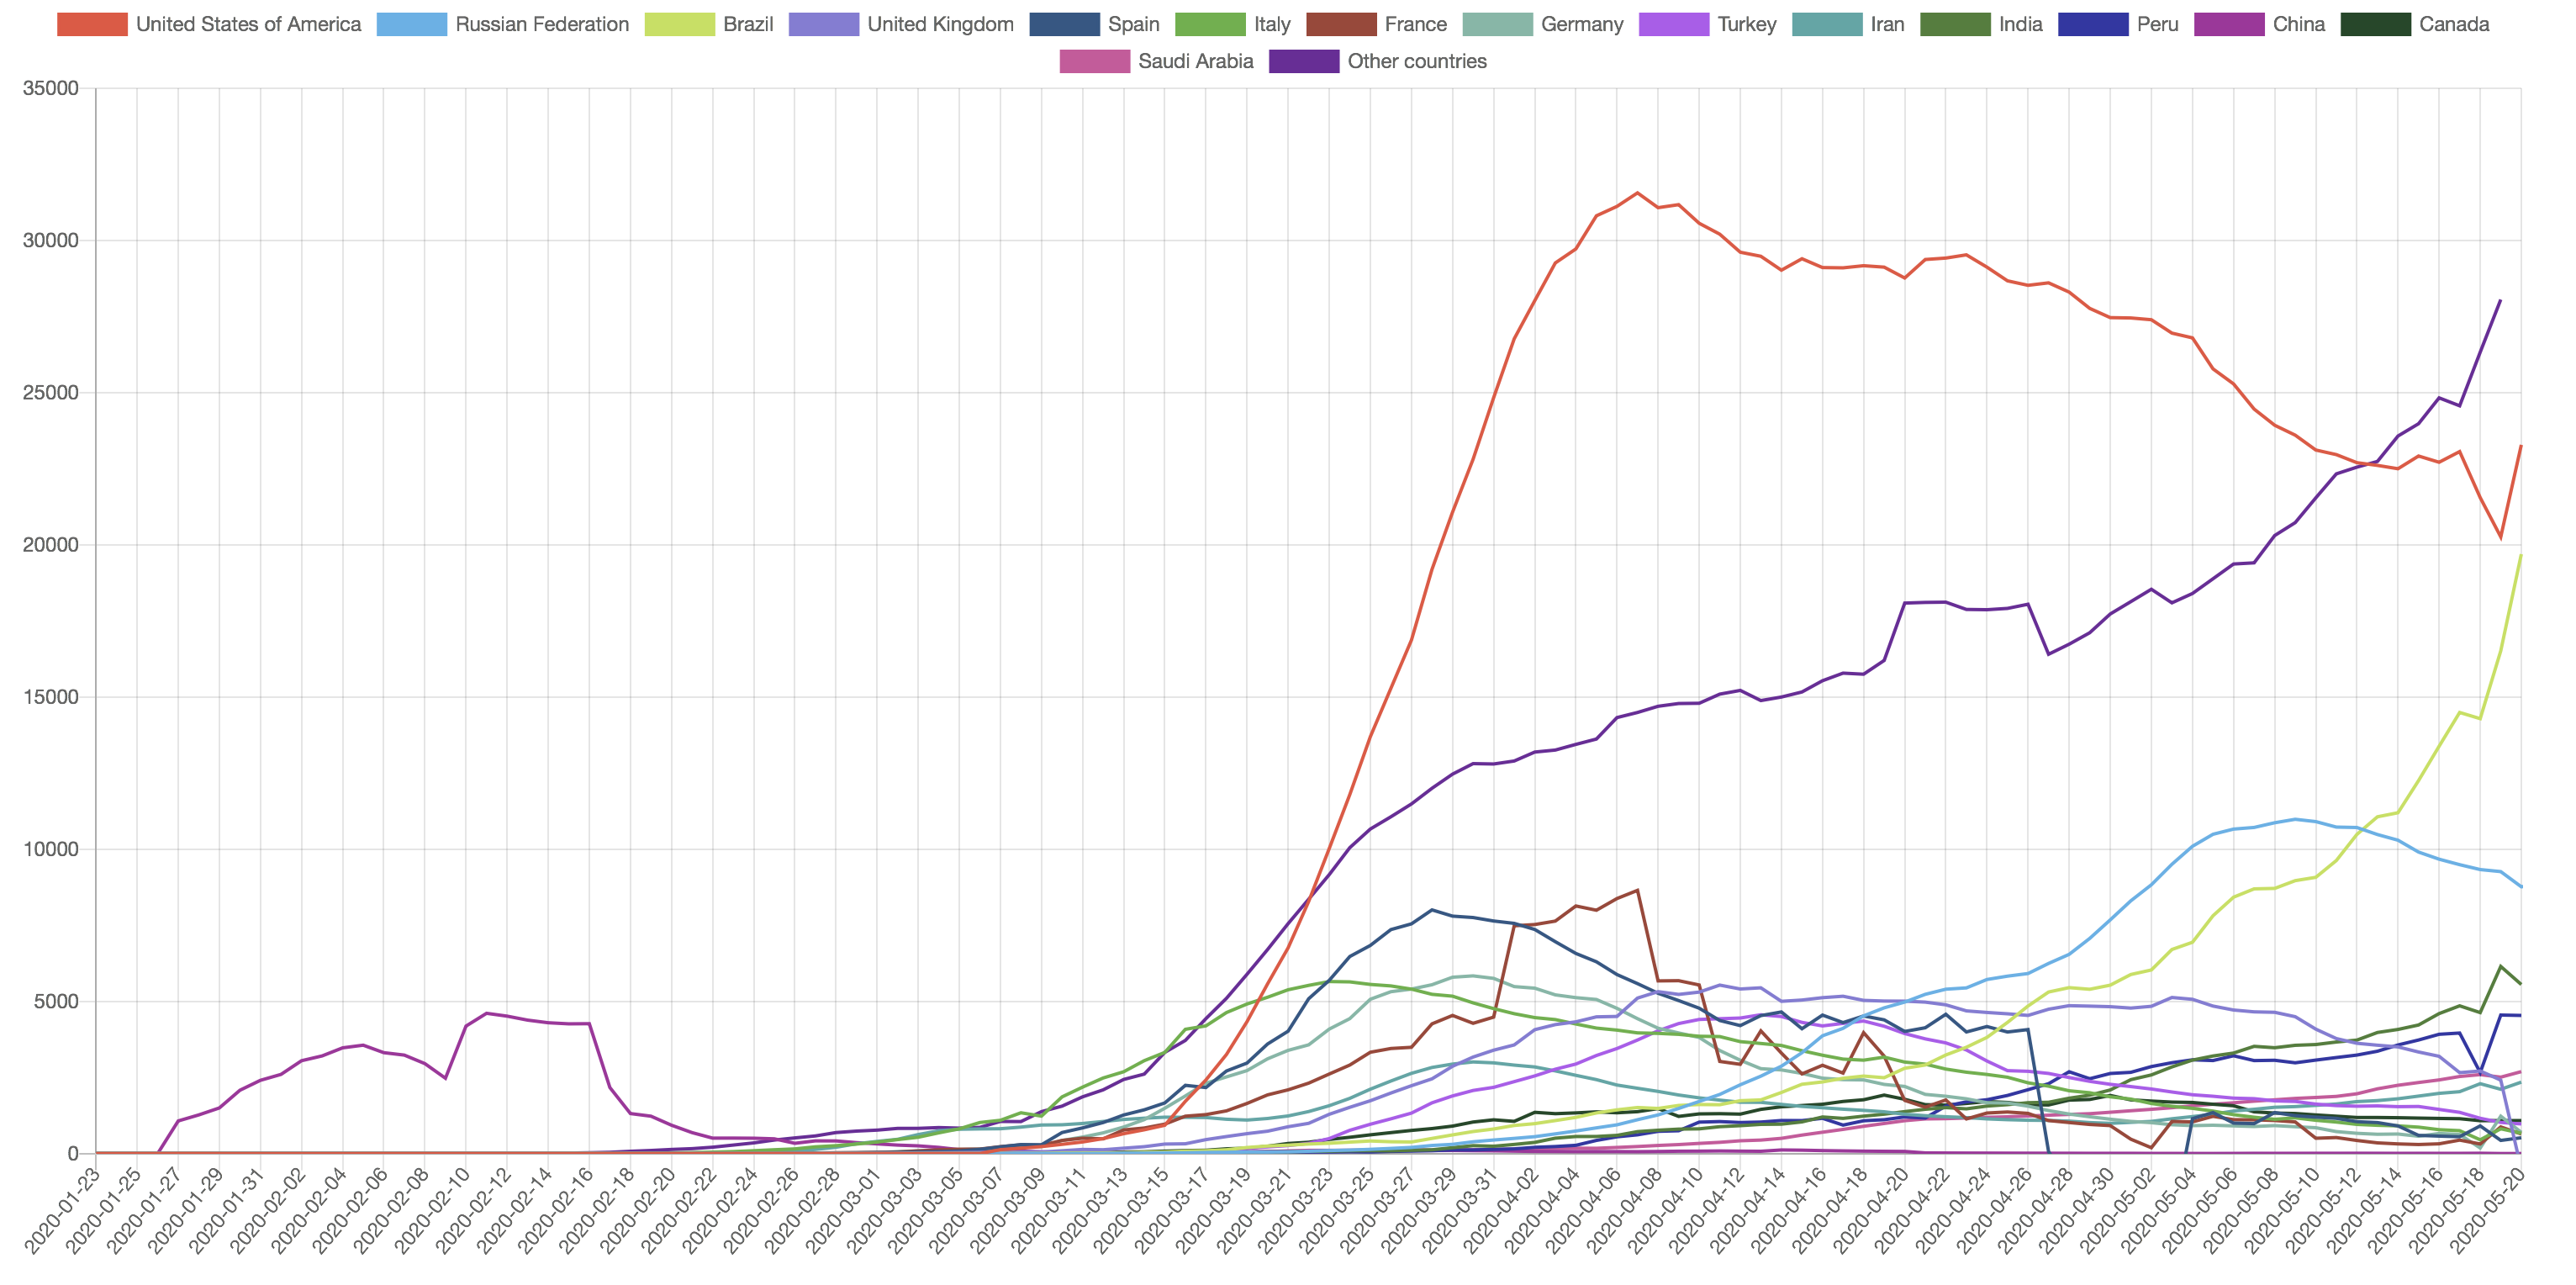
This graph helps to understand why the number of new daily cases is more or less stable during at least the last 1.5 months, as it is seen on the New Confirmed Cases graph:
April 20, 2020
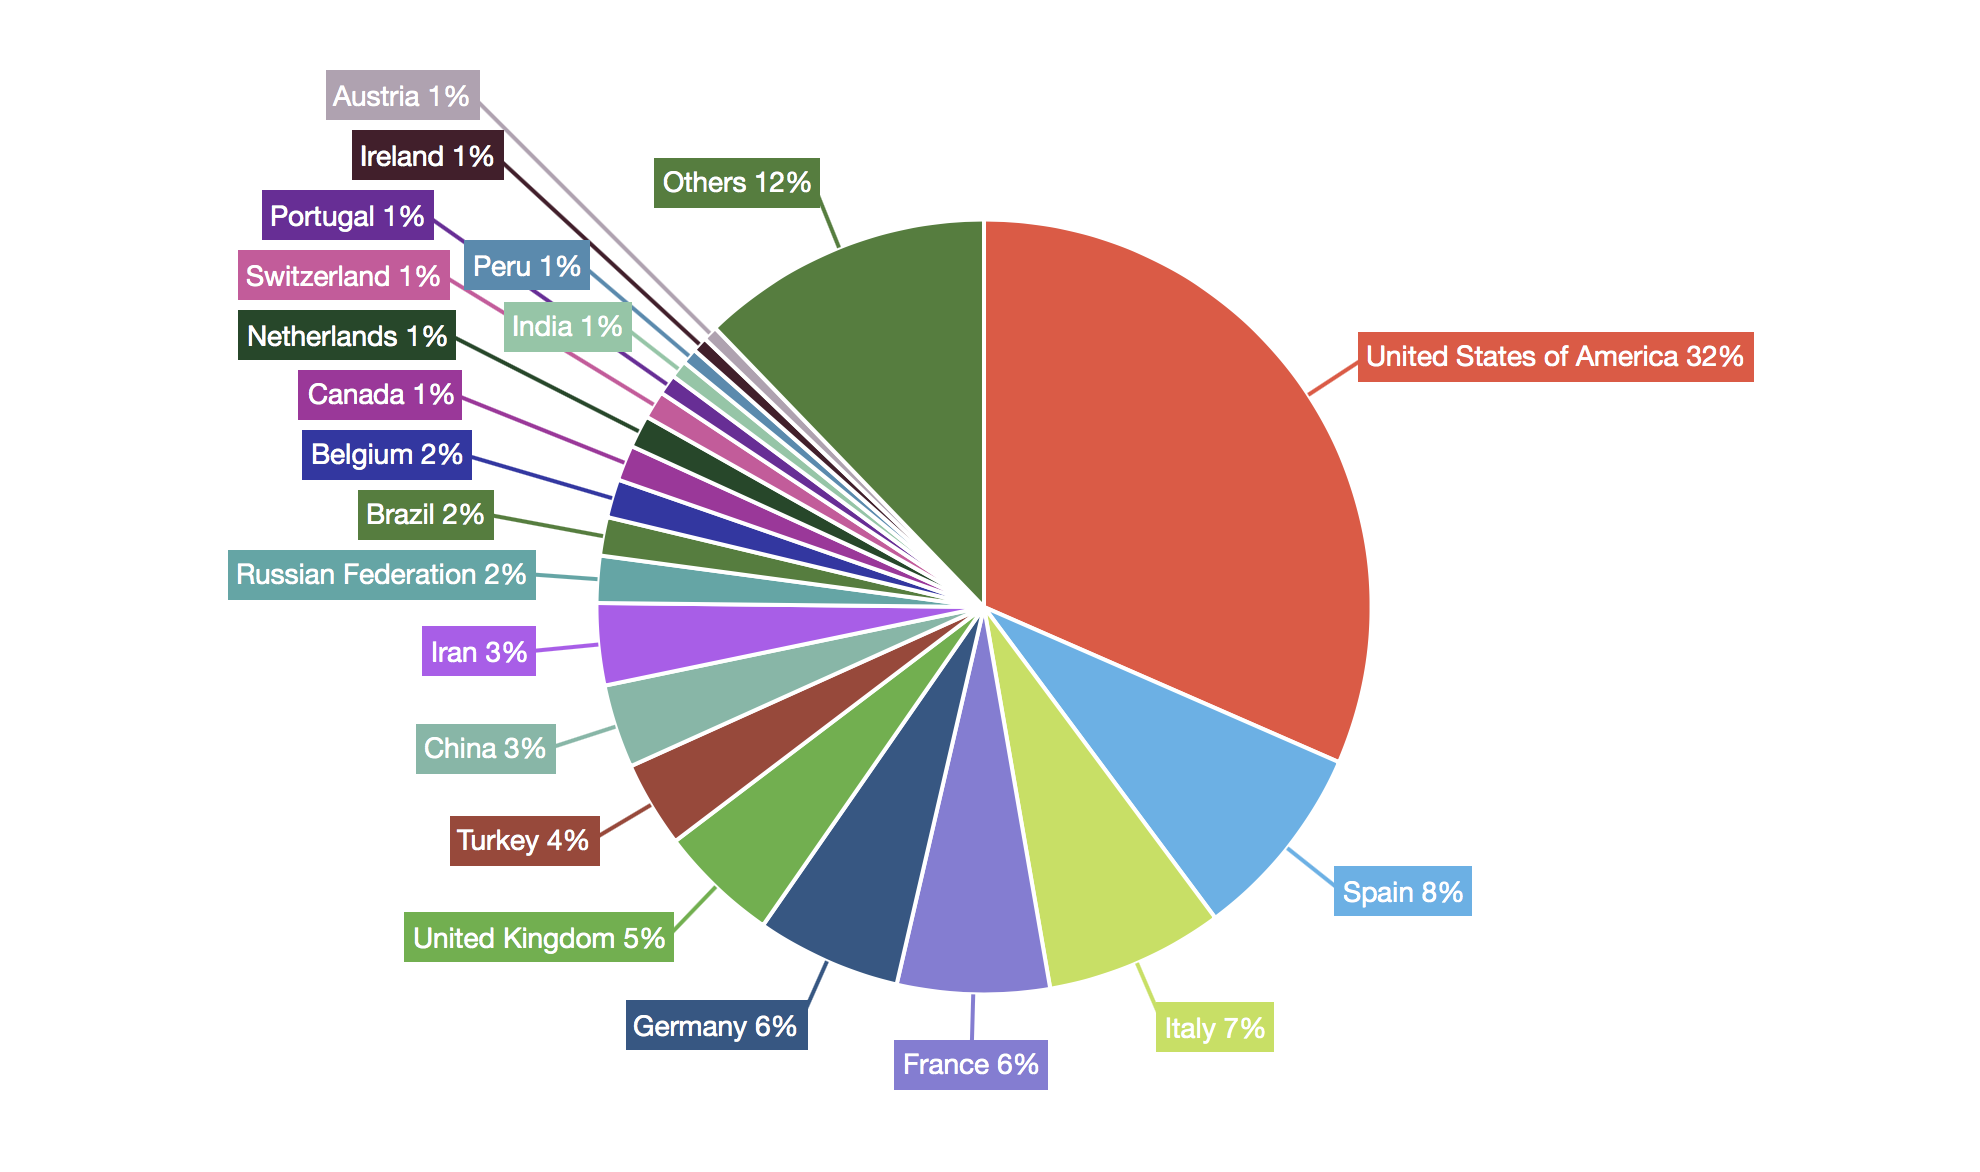
A new set of pages available on the site: pie charts to compare the number of confirmed coronavirus cases and fatal cases across different countries, states or regions (for the US, Russia, and China).
April 19, 2020
The Covid Observer is now available in Russian.
April 14, 2020
A post overviewing the new features that appeared during the last month is published in the blog.
April 13, 2020
The Russian Federation got separate pages for each of its regions. The data is collected from a separate official data source, and it may include more recent data than those of the JHU. To compare the situation in different regions, visit the comparison page.
For the USA, the number of recovered cases is now available on the state level (starting from today).
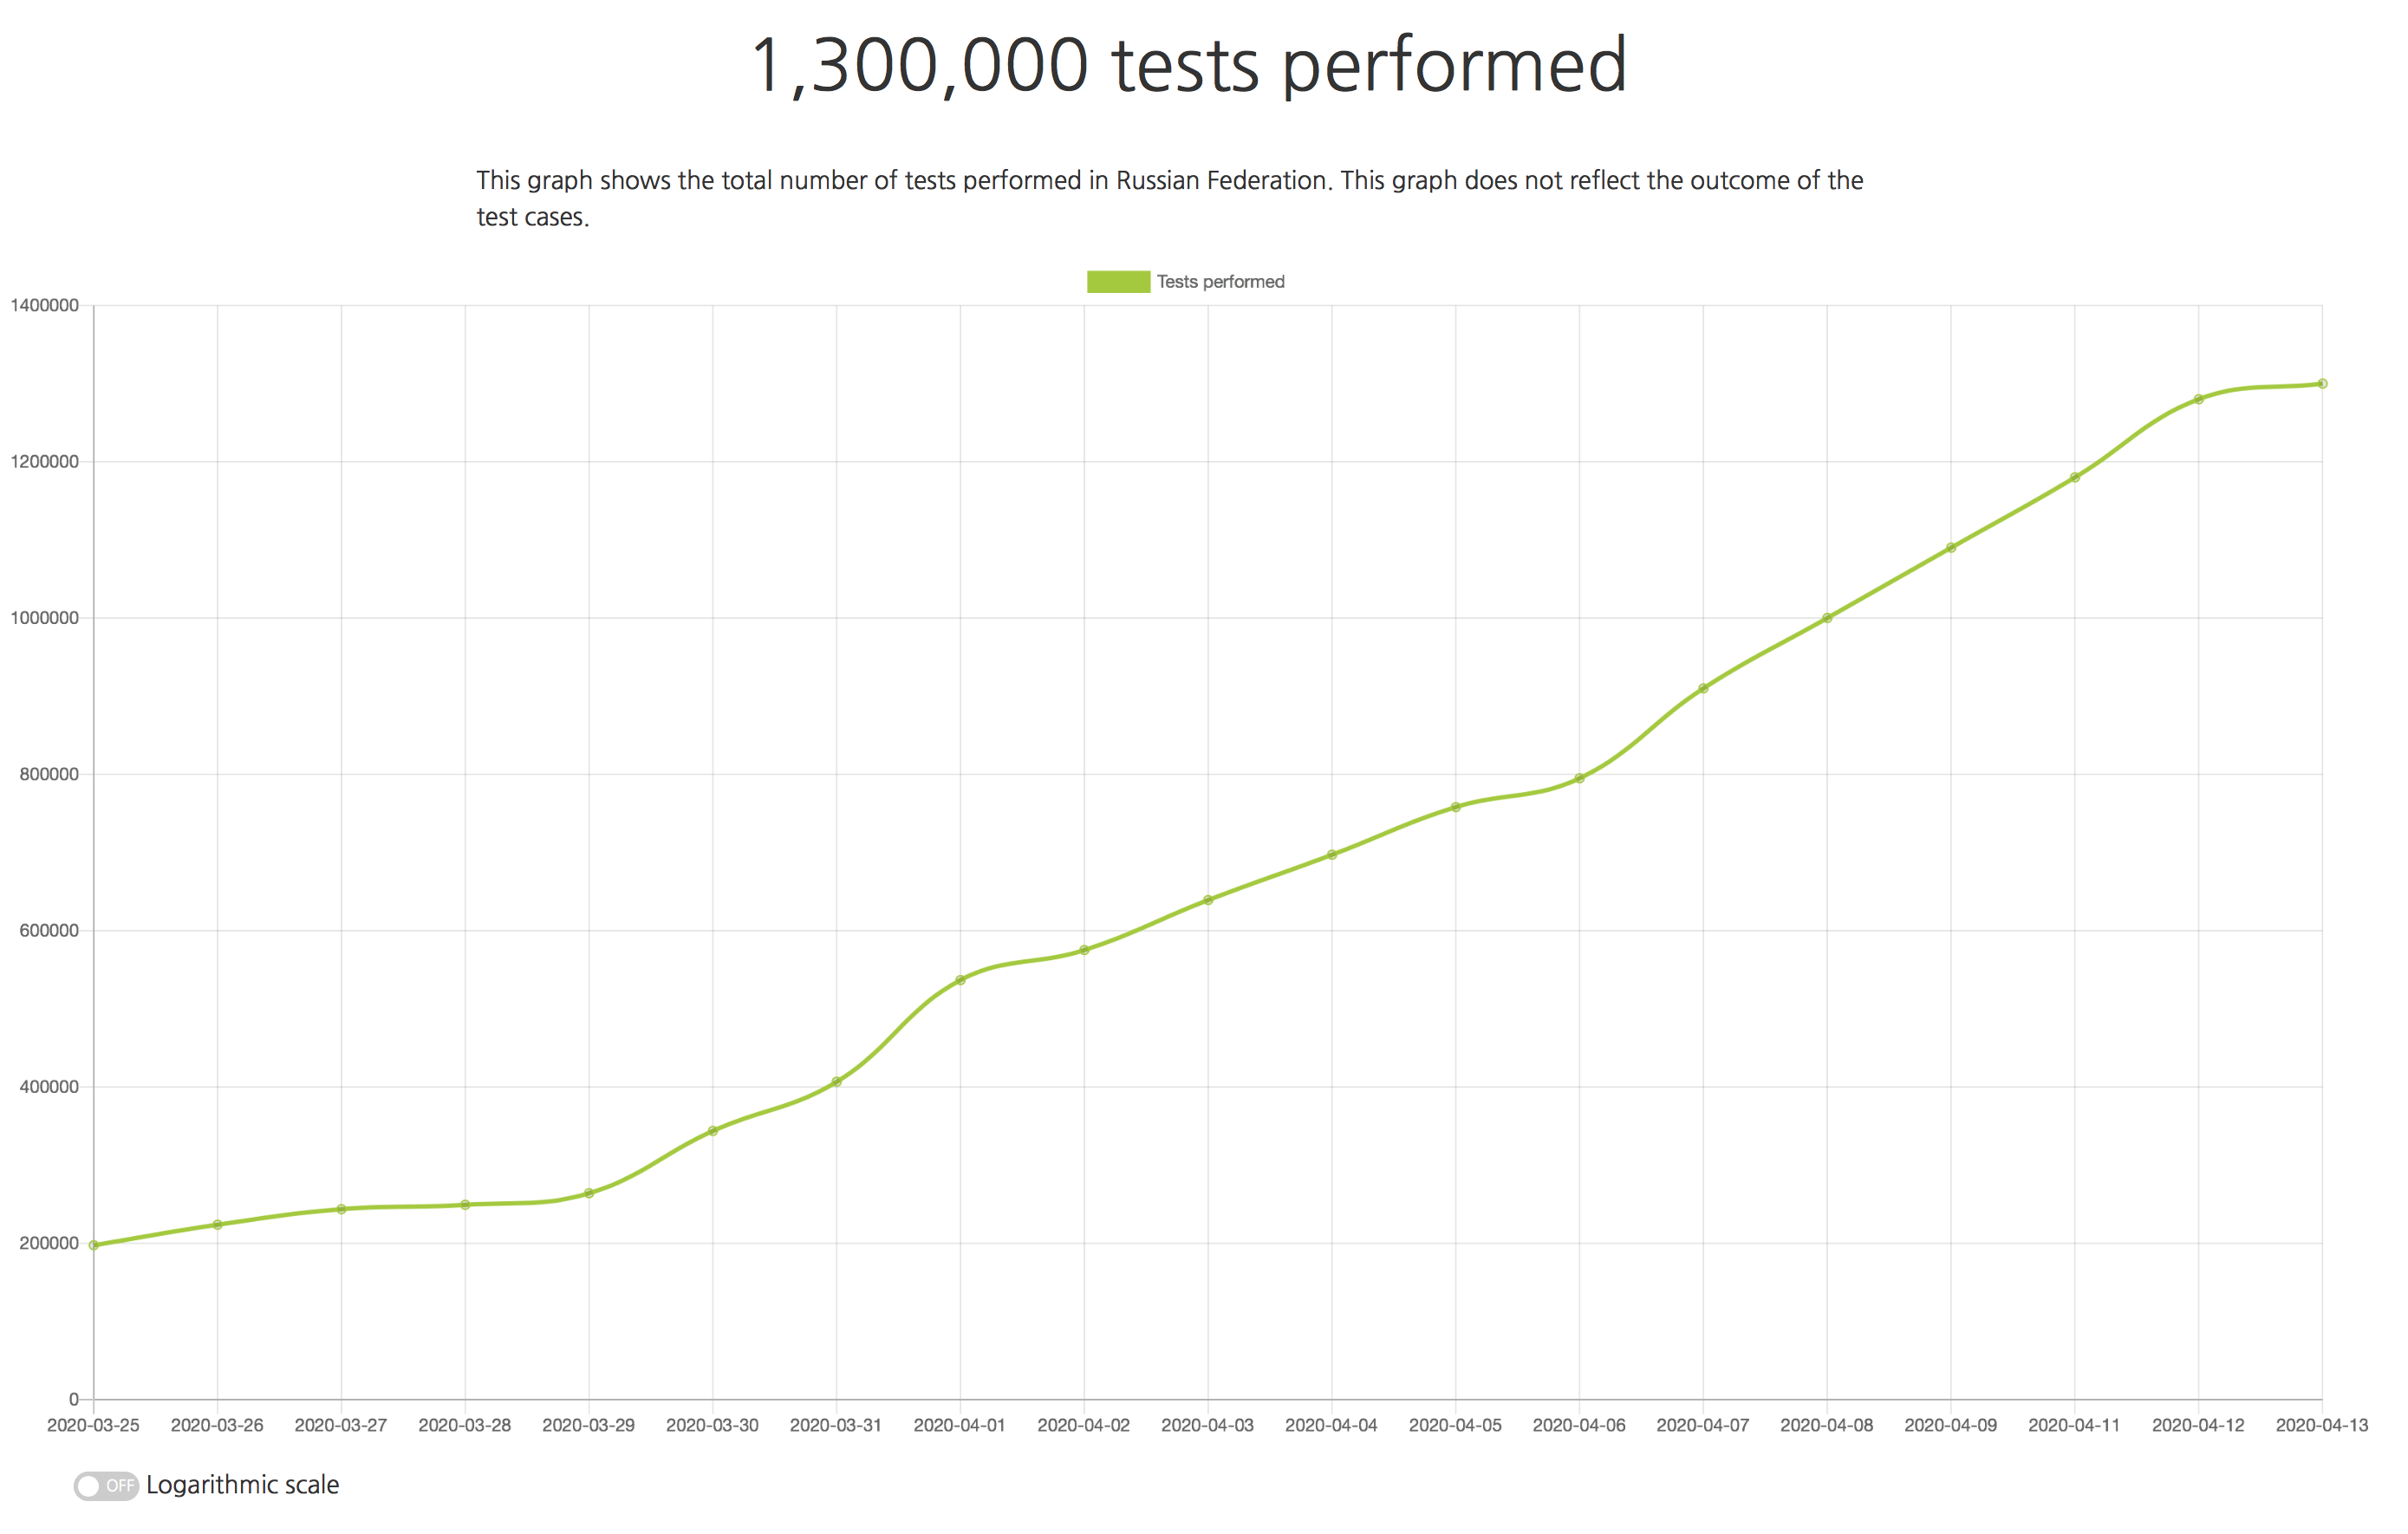
The pages for the USA (since April 12th), Russian Federation (since March 25th) and Ukraine (since April 8th) contain the number of tests performed on a country-level. For the USA, this data is detalised on a state level.
April 11, 2020
The red and green arrows displaying the trend in the change of the new confirmed daily cases is more granual now and includes five different indicator levels. Instead of taking the last two days only, the trend checker looks at the values during the recent seven days.
April 10, 2020
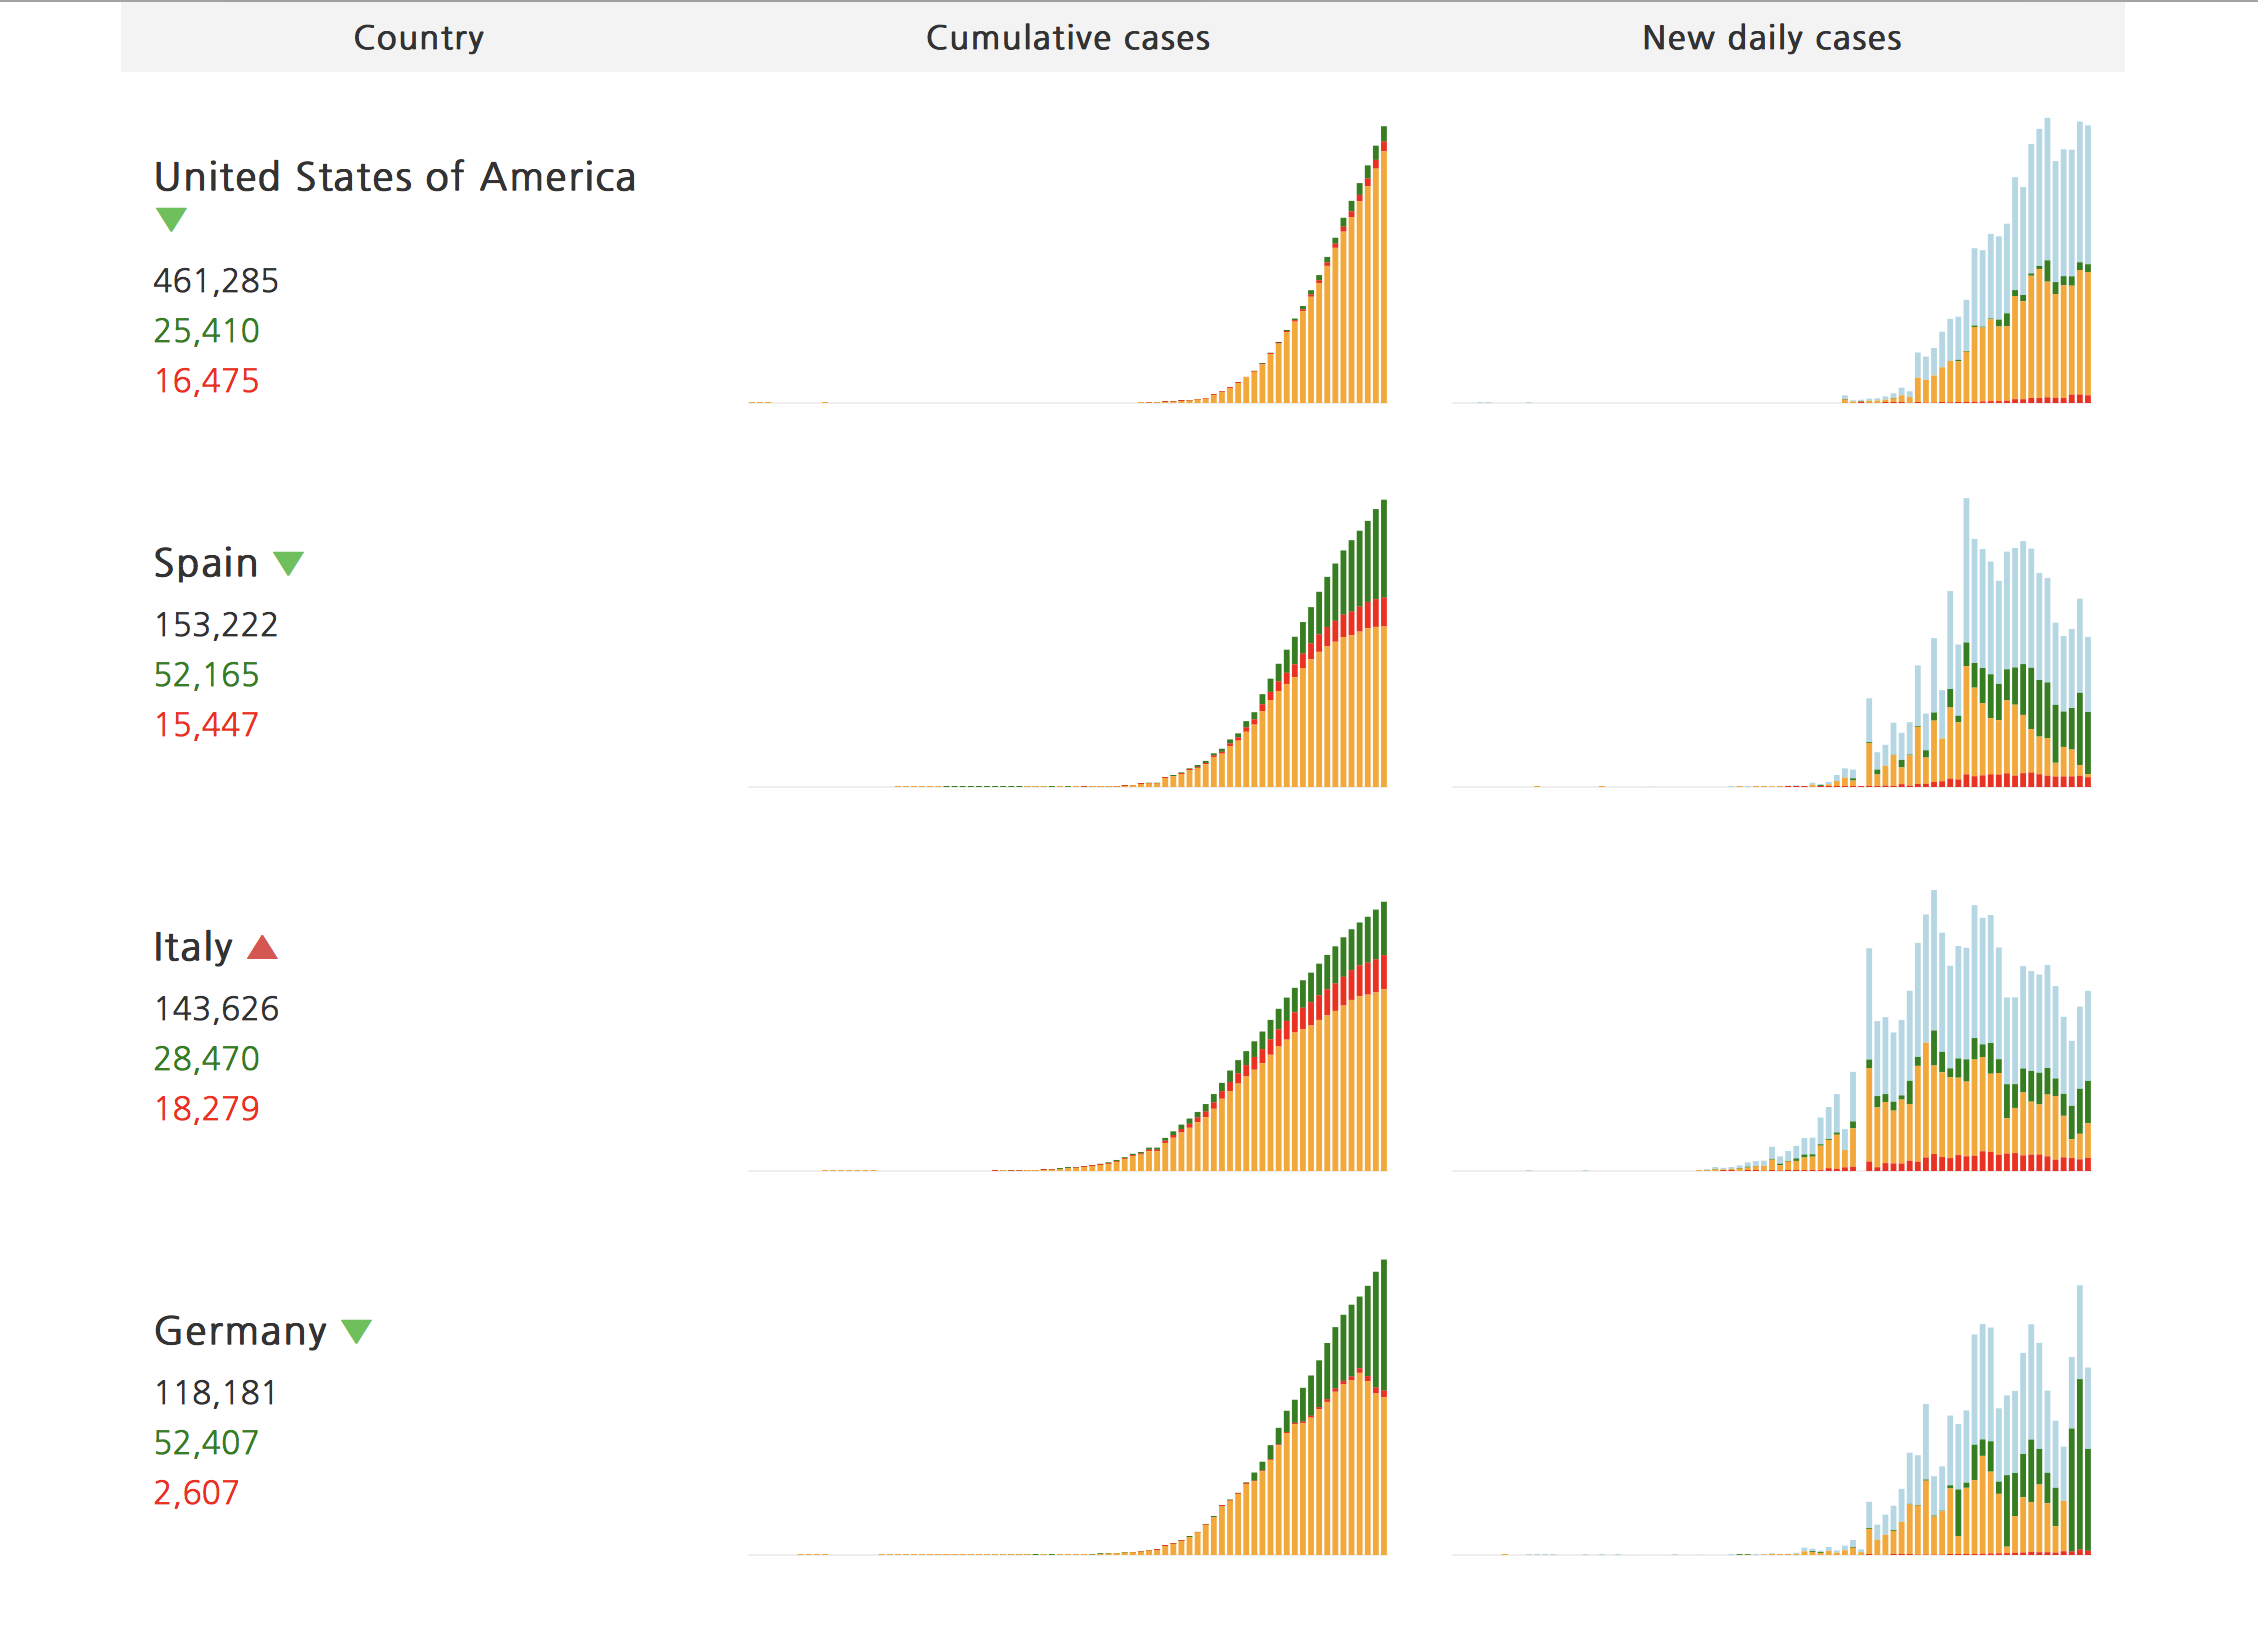
A new set of pages published on the site where you can compare the countries affected by coronavirus. For each country, there are a brief overview of the current numbers together with a couple of graphs: the absolute numbers of the confirmed, recovered, and fatal cases and the graph depicting the amount of new cases per day. Separate pages are dedicated to the US states and China provinces.
April 9, 2020
The per-million per capita values are replaces with per-thousand values. This change helps to avoid the weird-looking huge numbers for smaller countries where there are fewer than a million people. With this change, the numbers are displayed in the same scale as the crude country-level graphs.
April 8, 2020
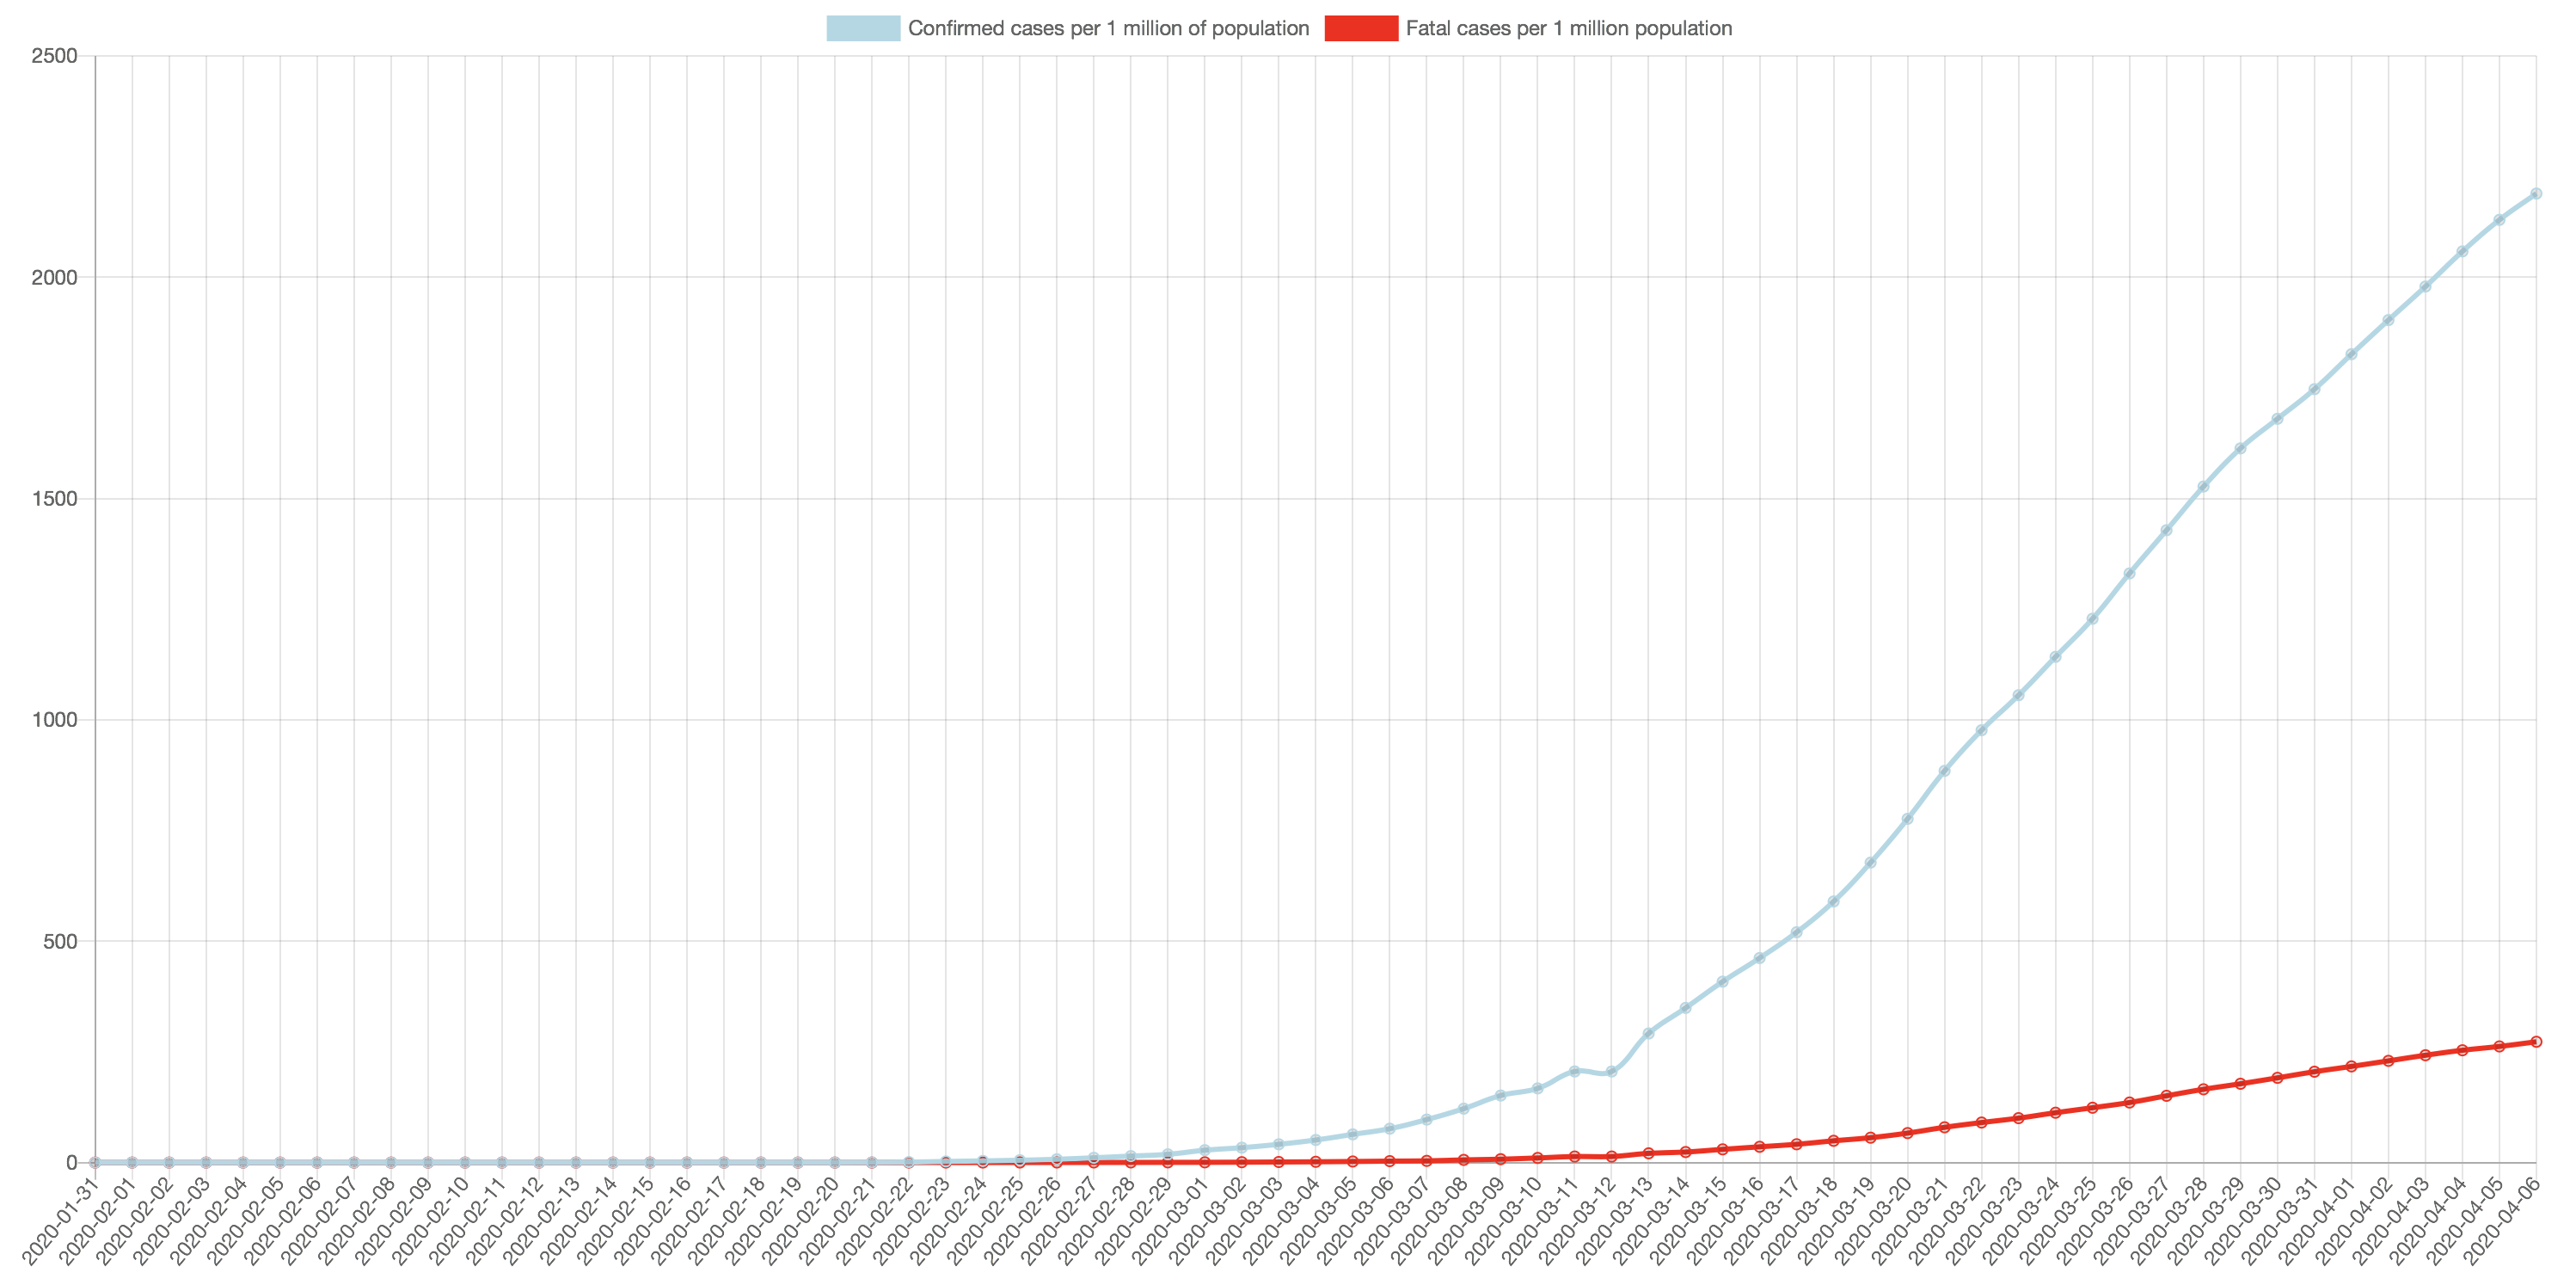
Per capita (in fact, per-million) data are added at all levels of the site: World, continents, countries, and regions. These are the numbers of confirmed and fatal cases per each million of population (of the World, or country, etc.). For the countries that have fewer than a million of population, the same scale is used so that you can compare different countires without the need to re-normalise the numbers. The per capita values are also added to the top block of data on the corresponding pages, to the table representation (including the CSV and XLS exports), and as a separate graph on each page. Don’t forget that there is a separate set of pages to compare the countries based on per-capita values.
For example, per-million timeline in Italy:
April 7, 2020
Table data on all pages (World, continents, countries, and regions) are now available for downloading in the CSV and XLS formats.
April 6, 2020
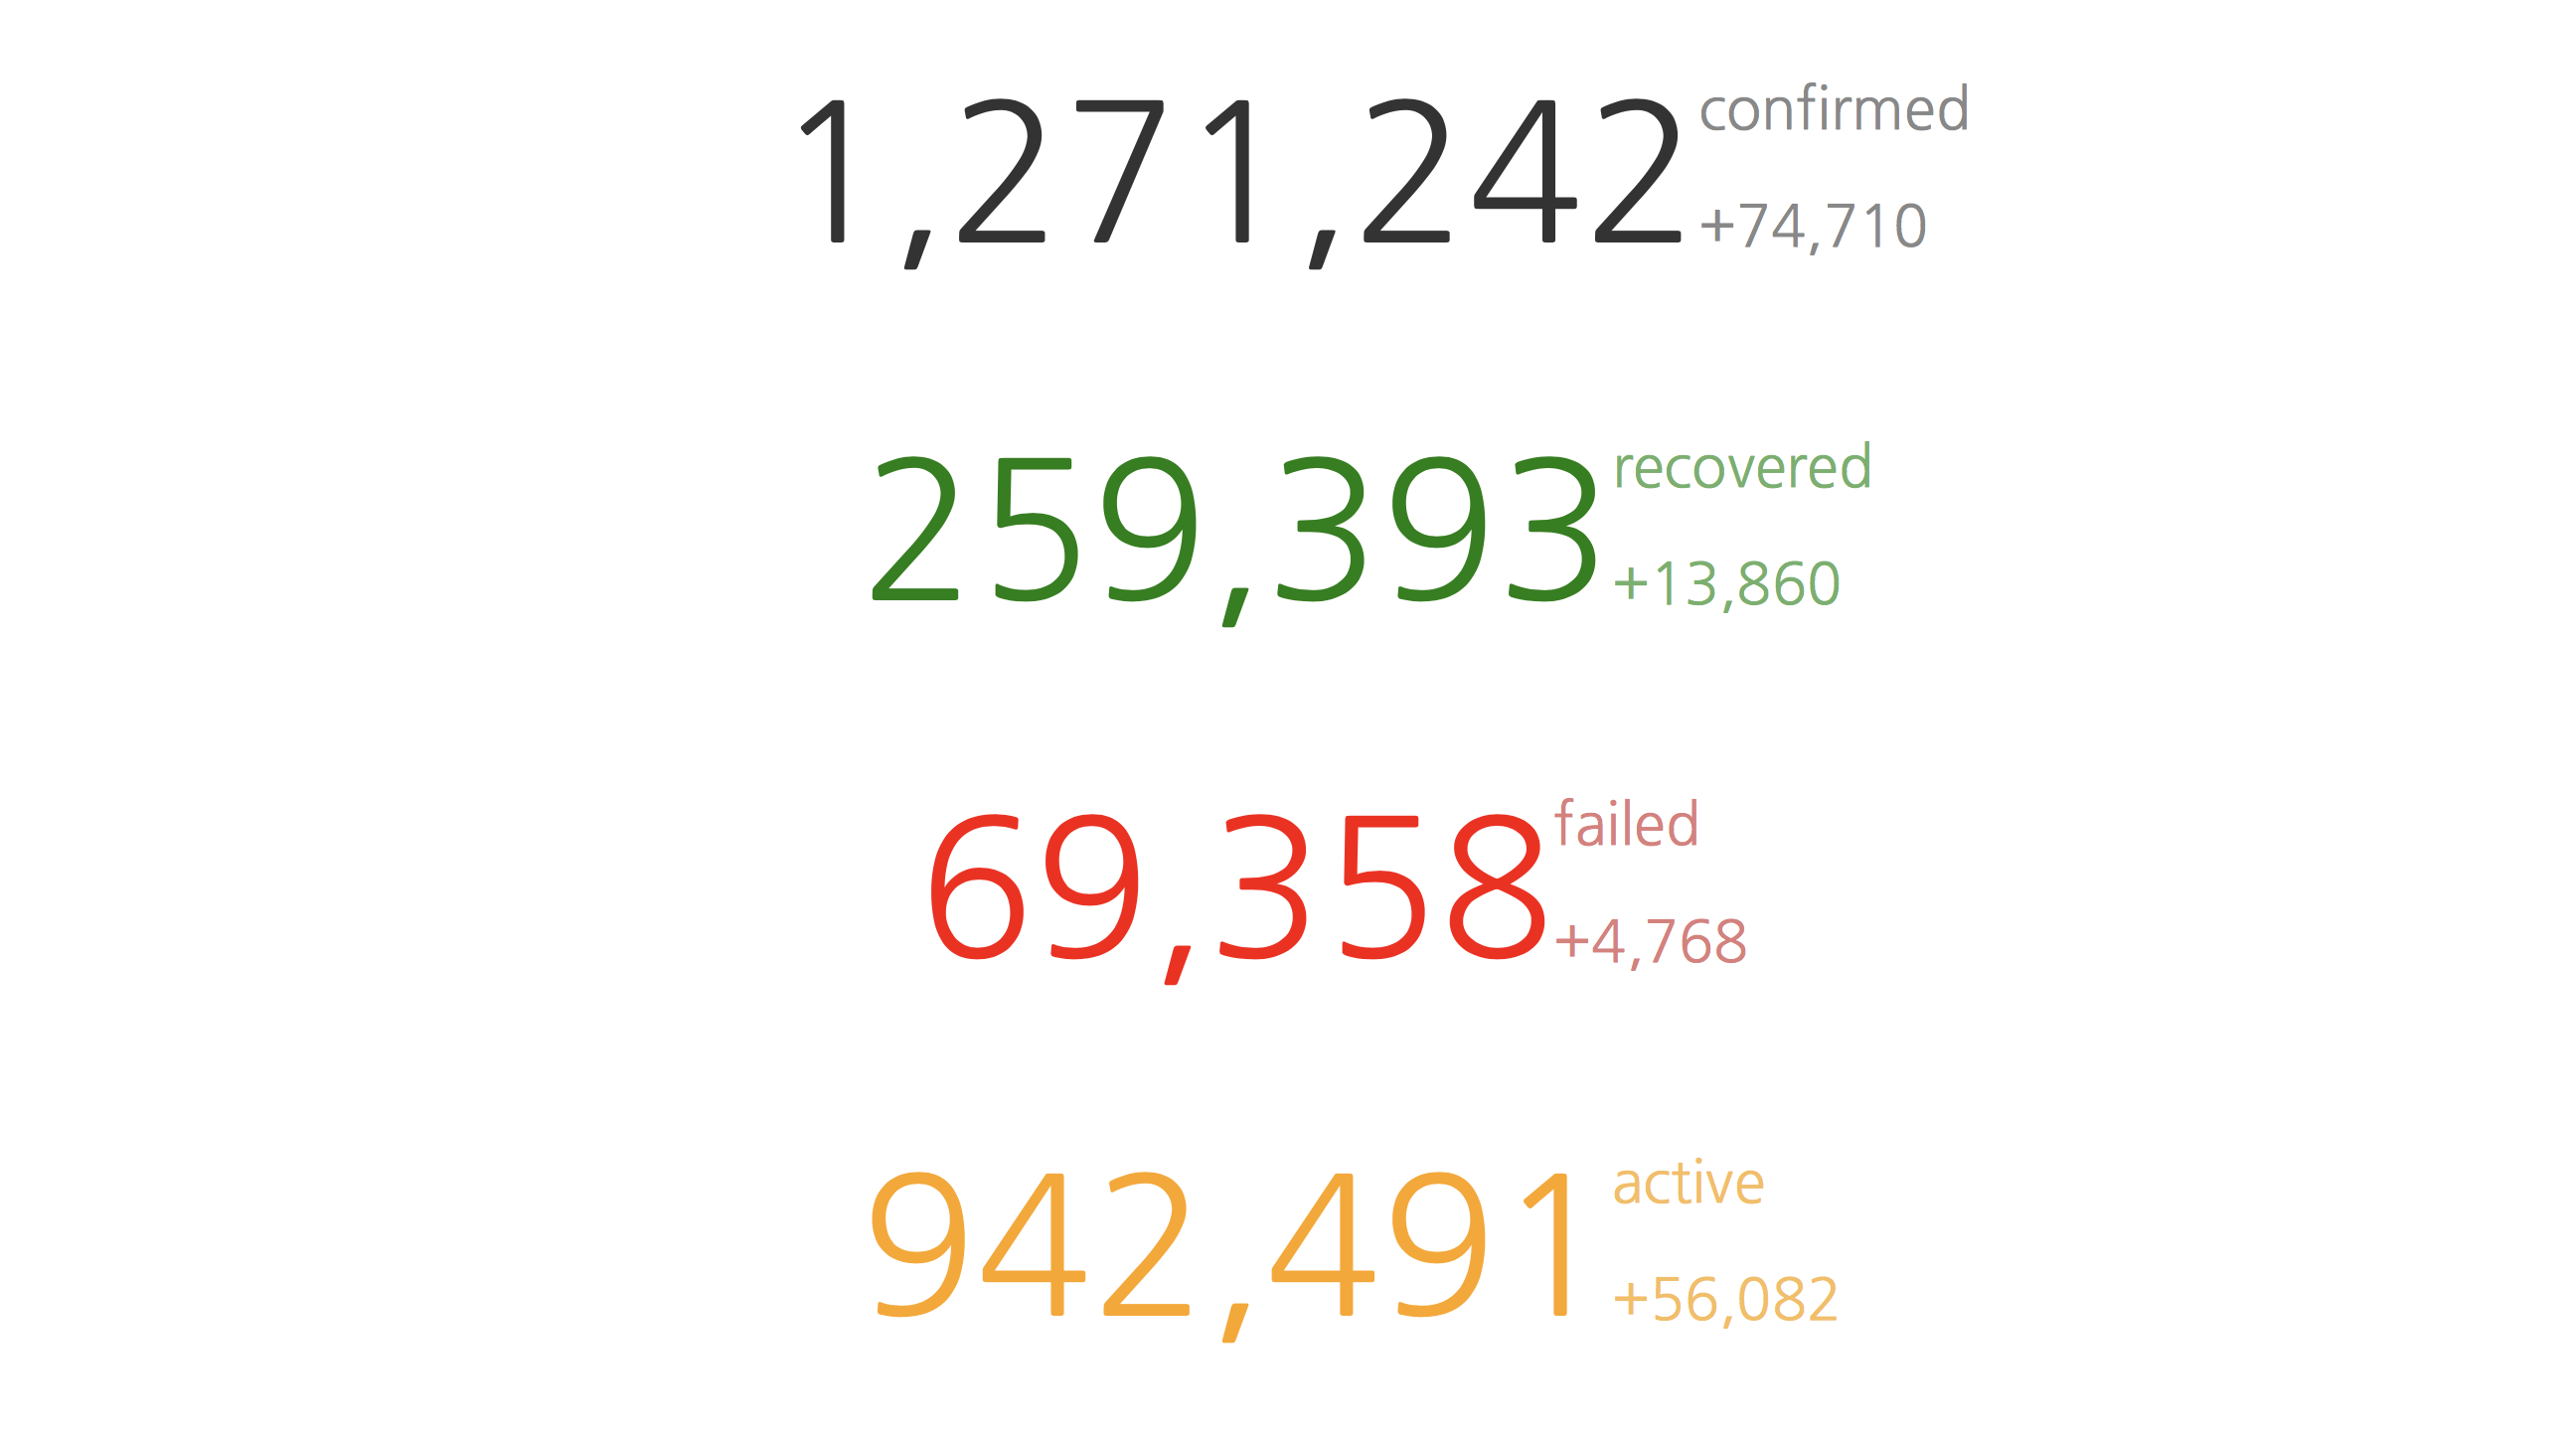
The main numbers are equipped with the changes happend since yesterday.
April 5, 2020
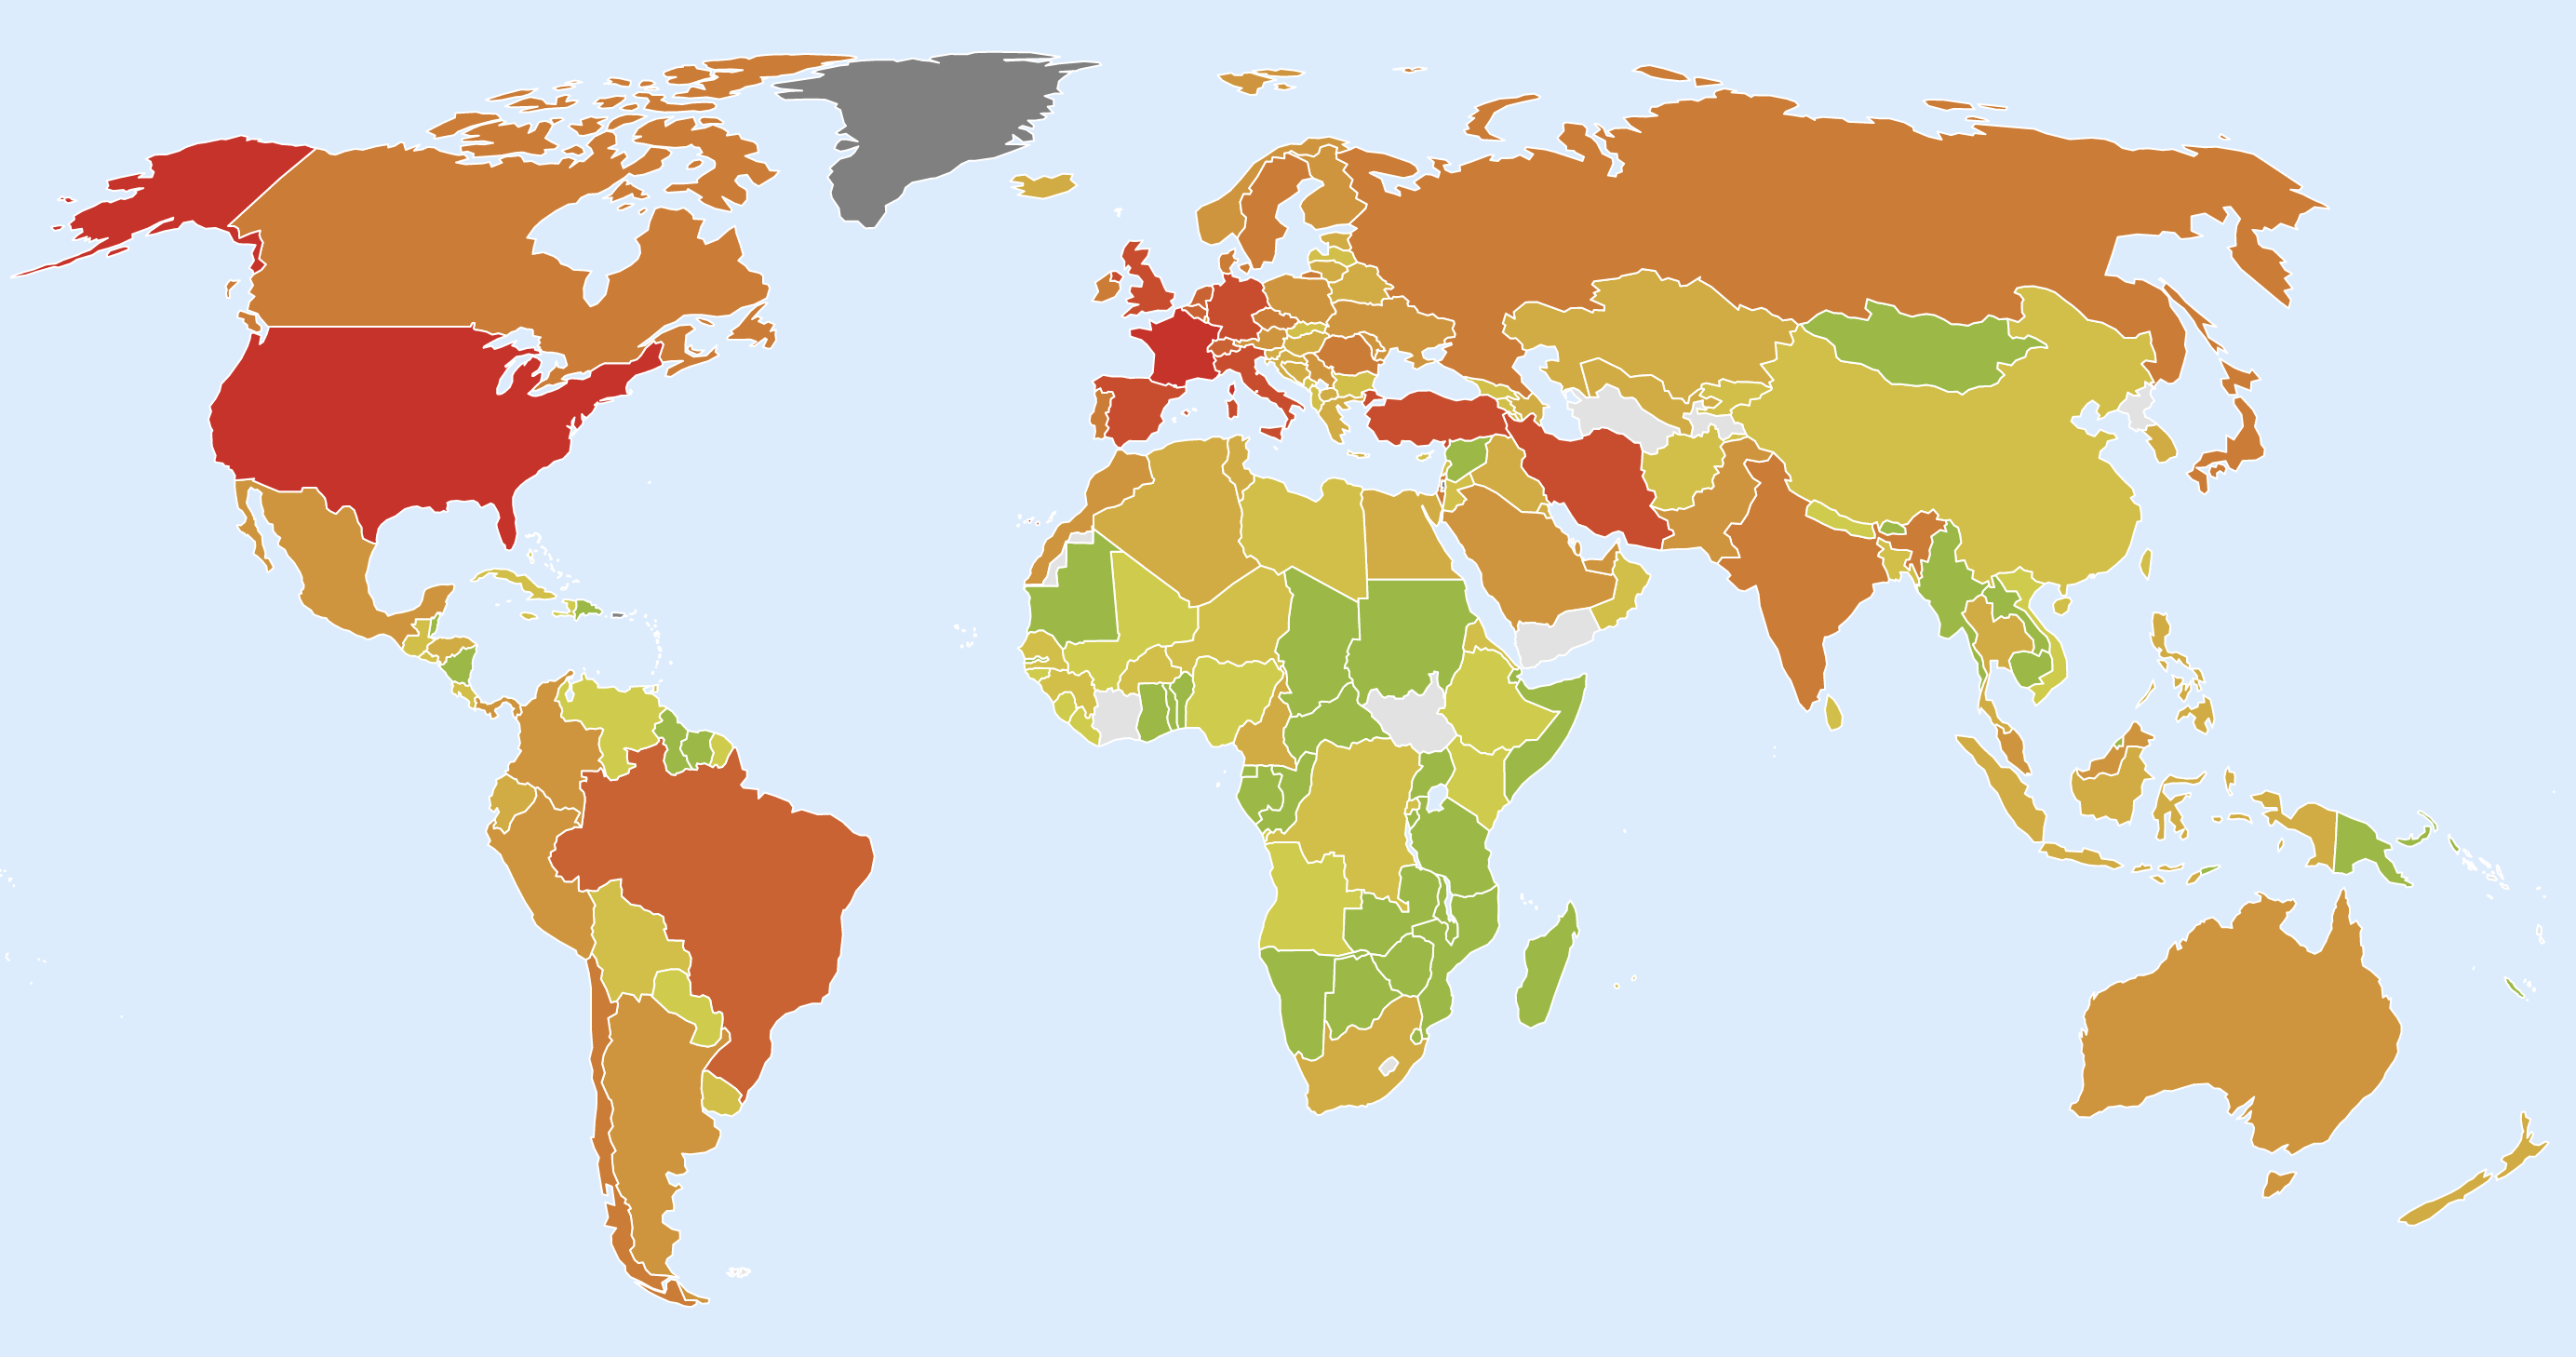
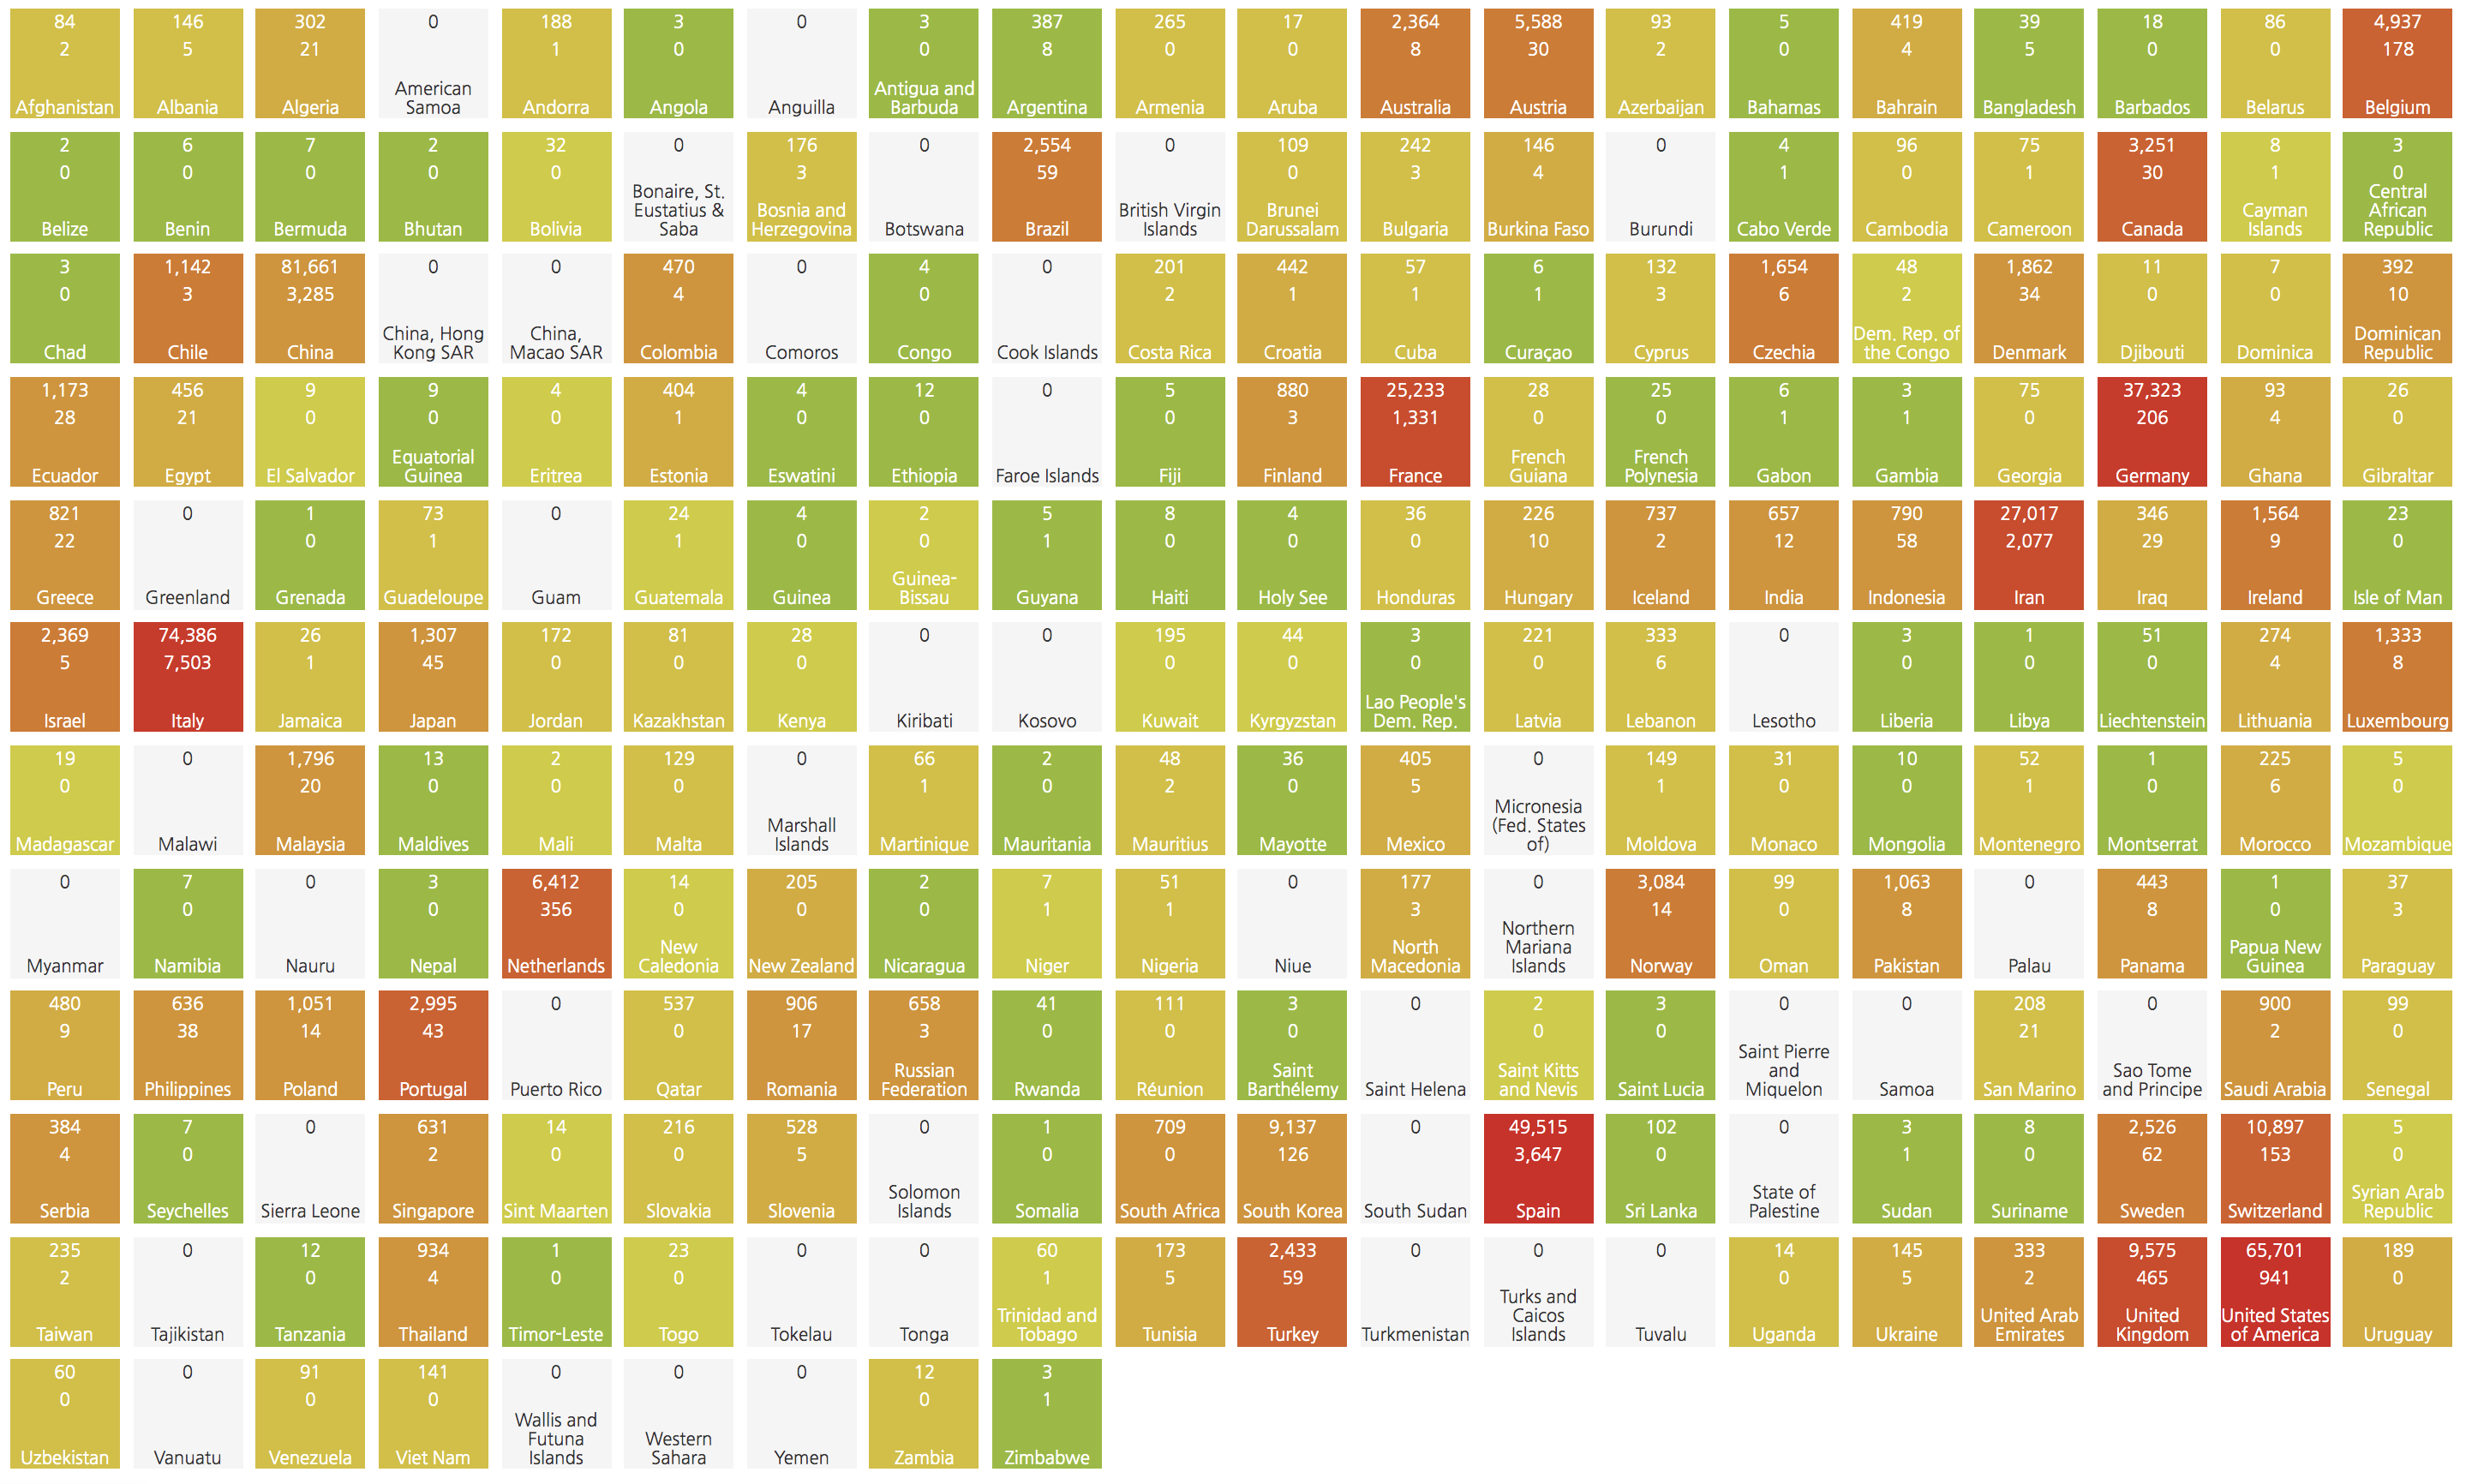
New feature on the site: an overview of the World on the map. Move the mouse over the country to see a brief COVID-19 statistics. Click on the country to get a more detailed overview on a country-level page. The colour indication follows the same principle as on the World overview page: the greener the colour, the fewer new cases have been registered in the given country during the last day comparing to the day before (that’s why China is greenish).
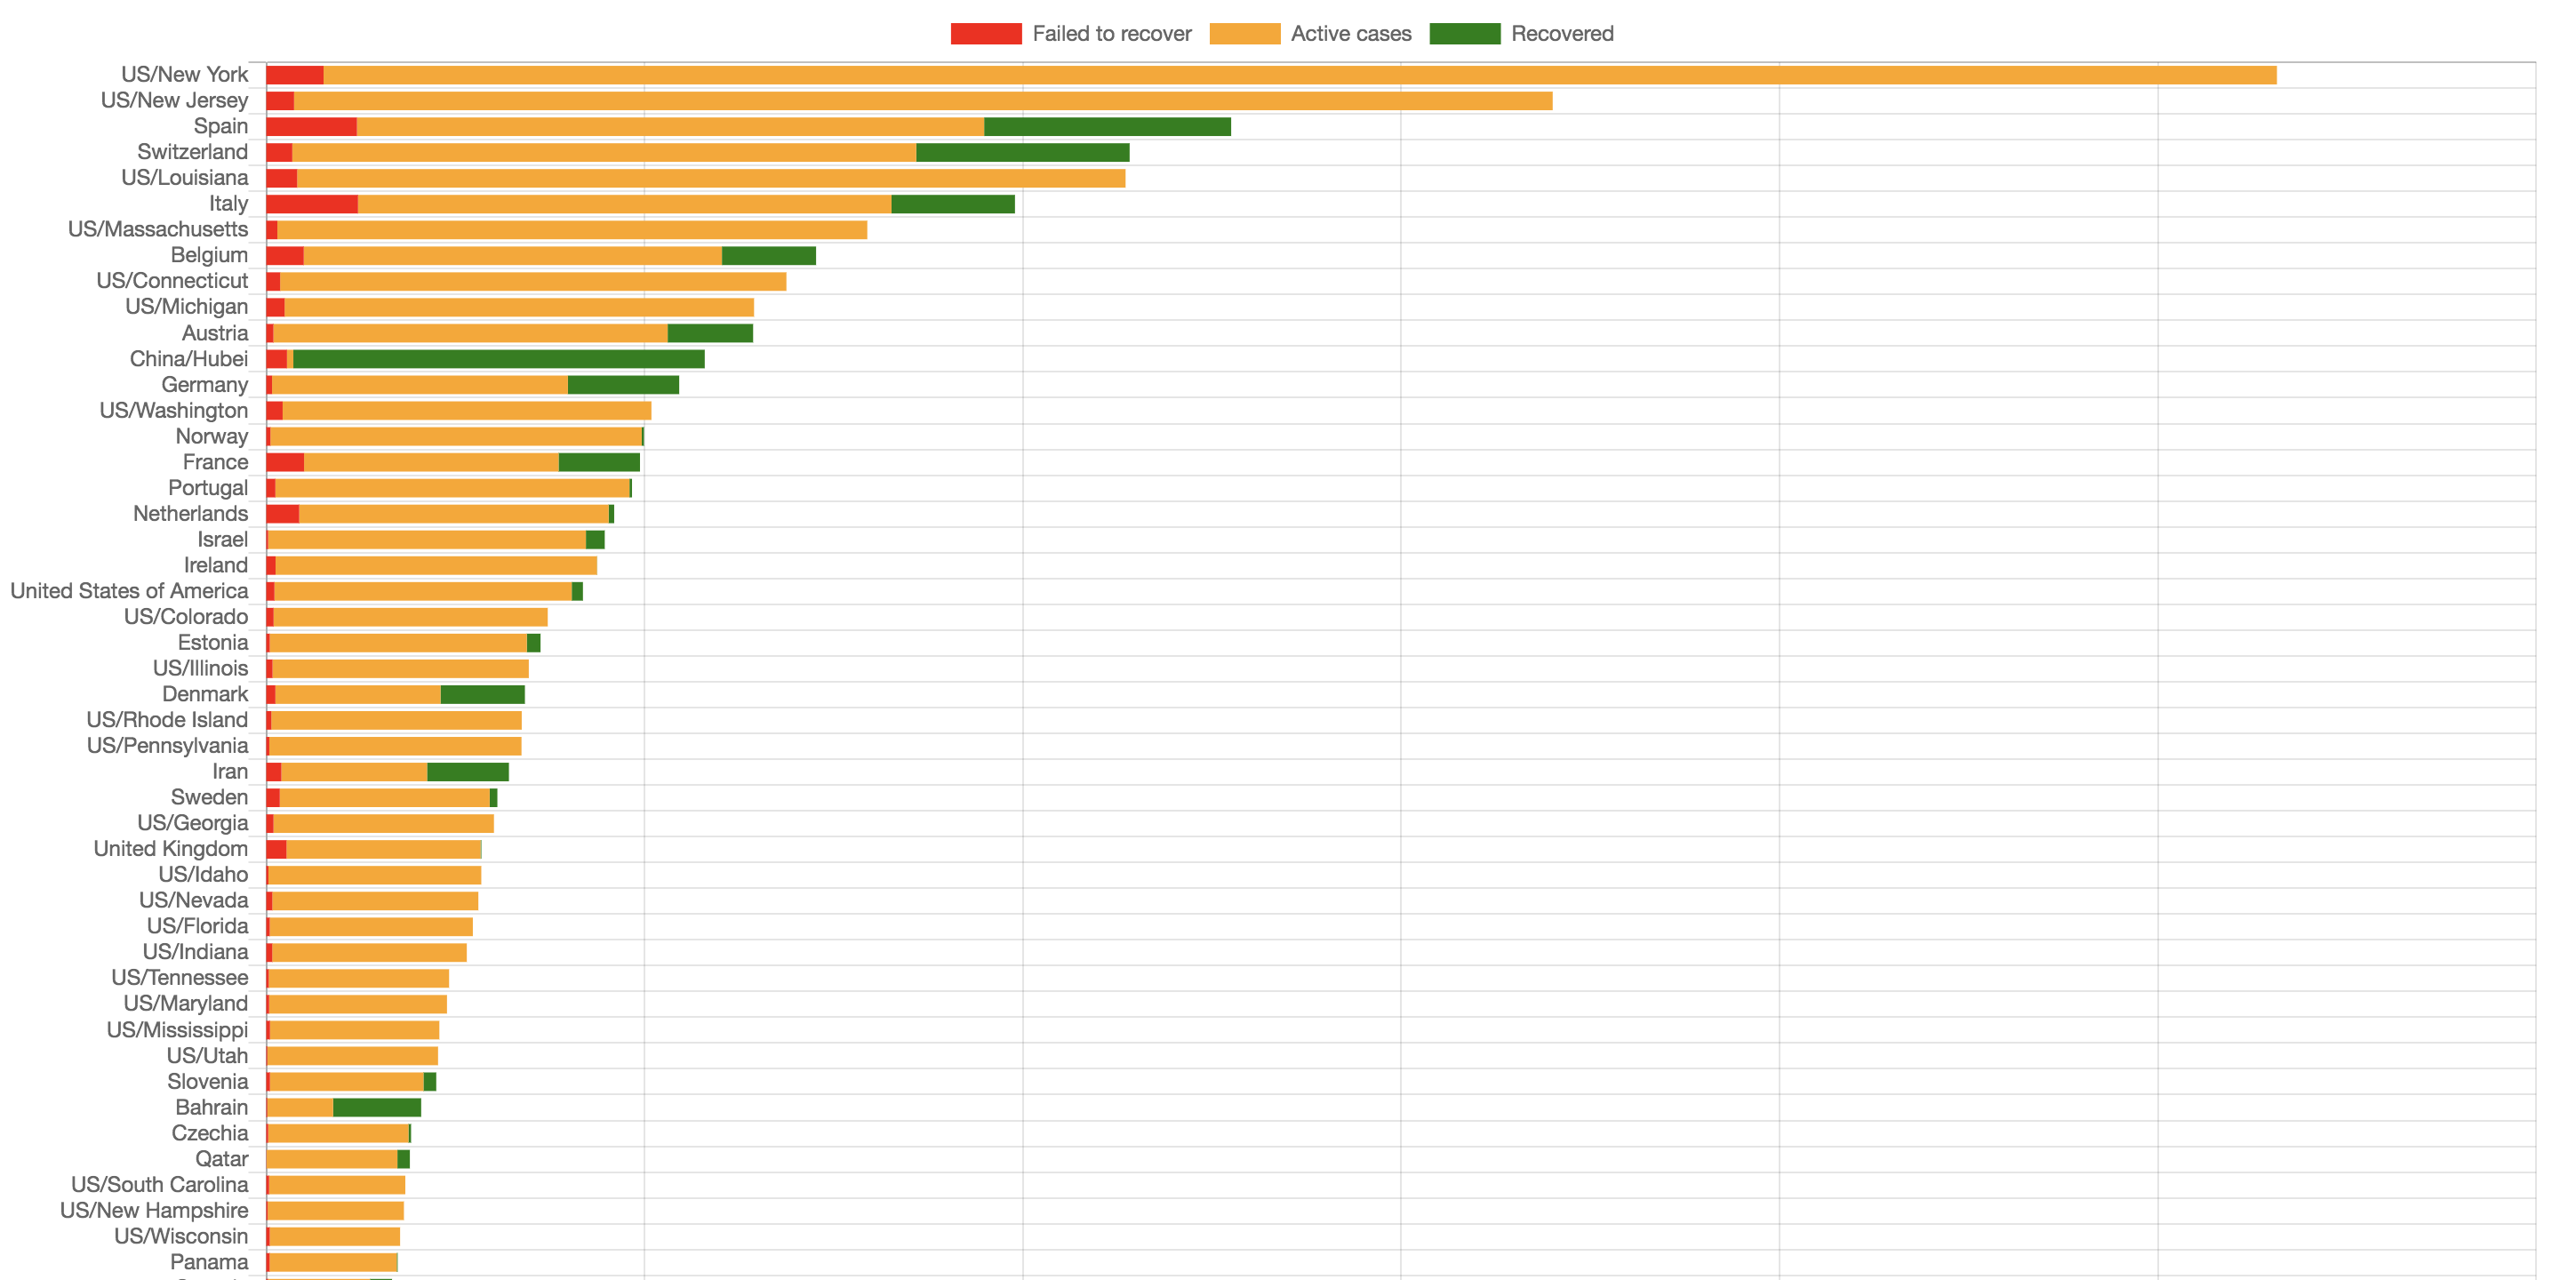
Per capita bar graphs are split into four groups with two graphs in each:
- Countries only sorted by the number of confirmed or failed cases
- US states — confirmed or failed
- China provinces — confirmed or failed
- Combined — confirmed or failed — these charts may include both countries and country regions whenever they match the sort criteria
April 4, 2020
A few new data blocks:
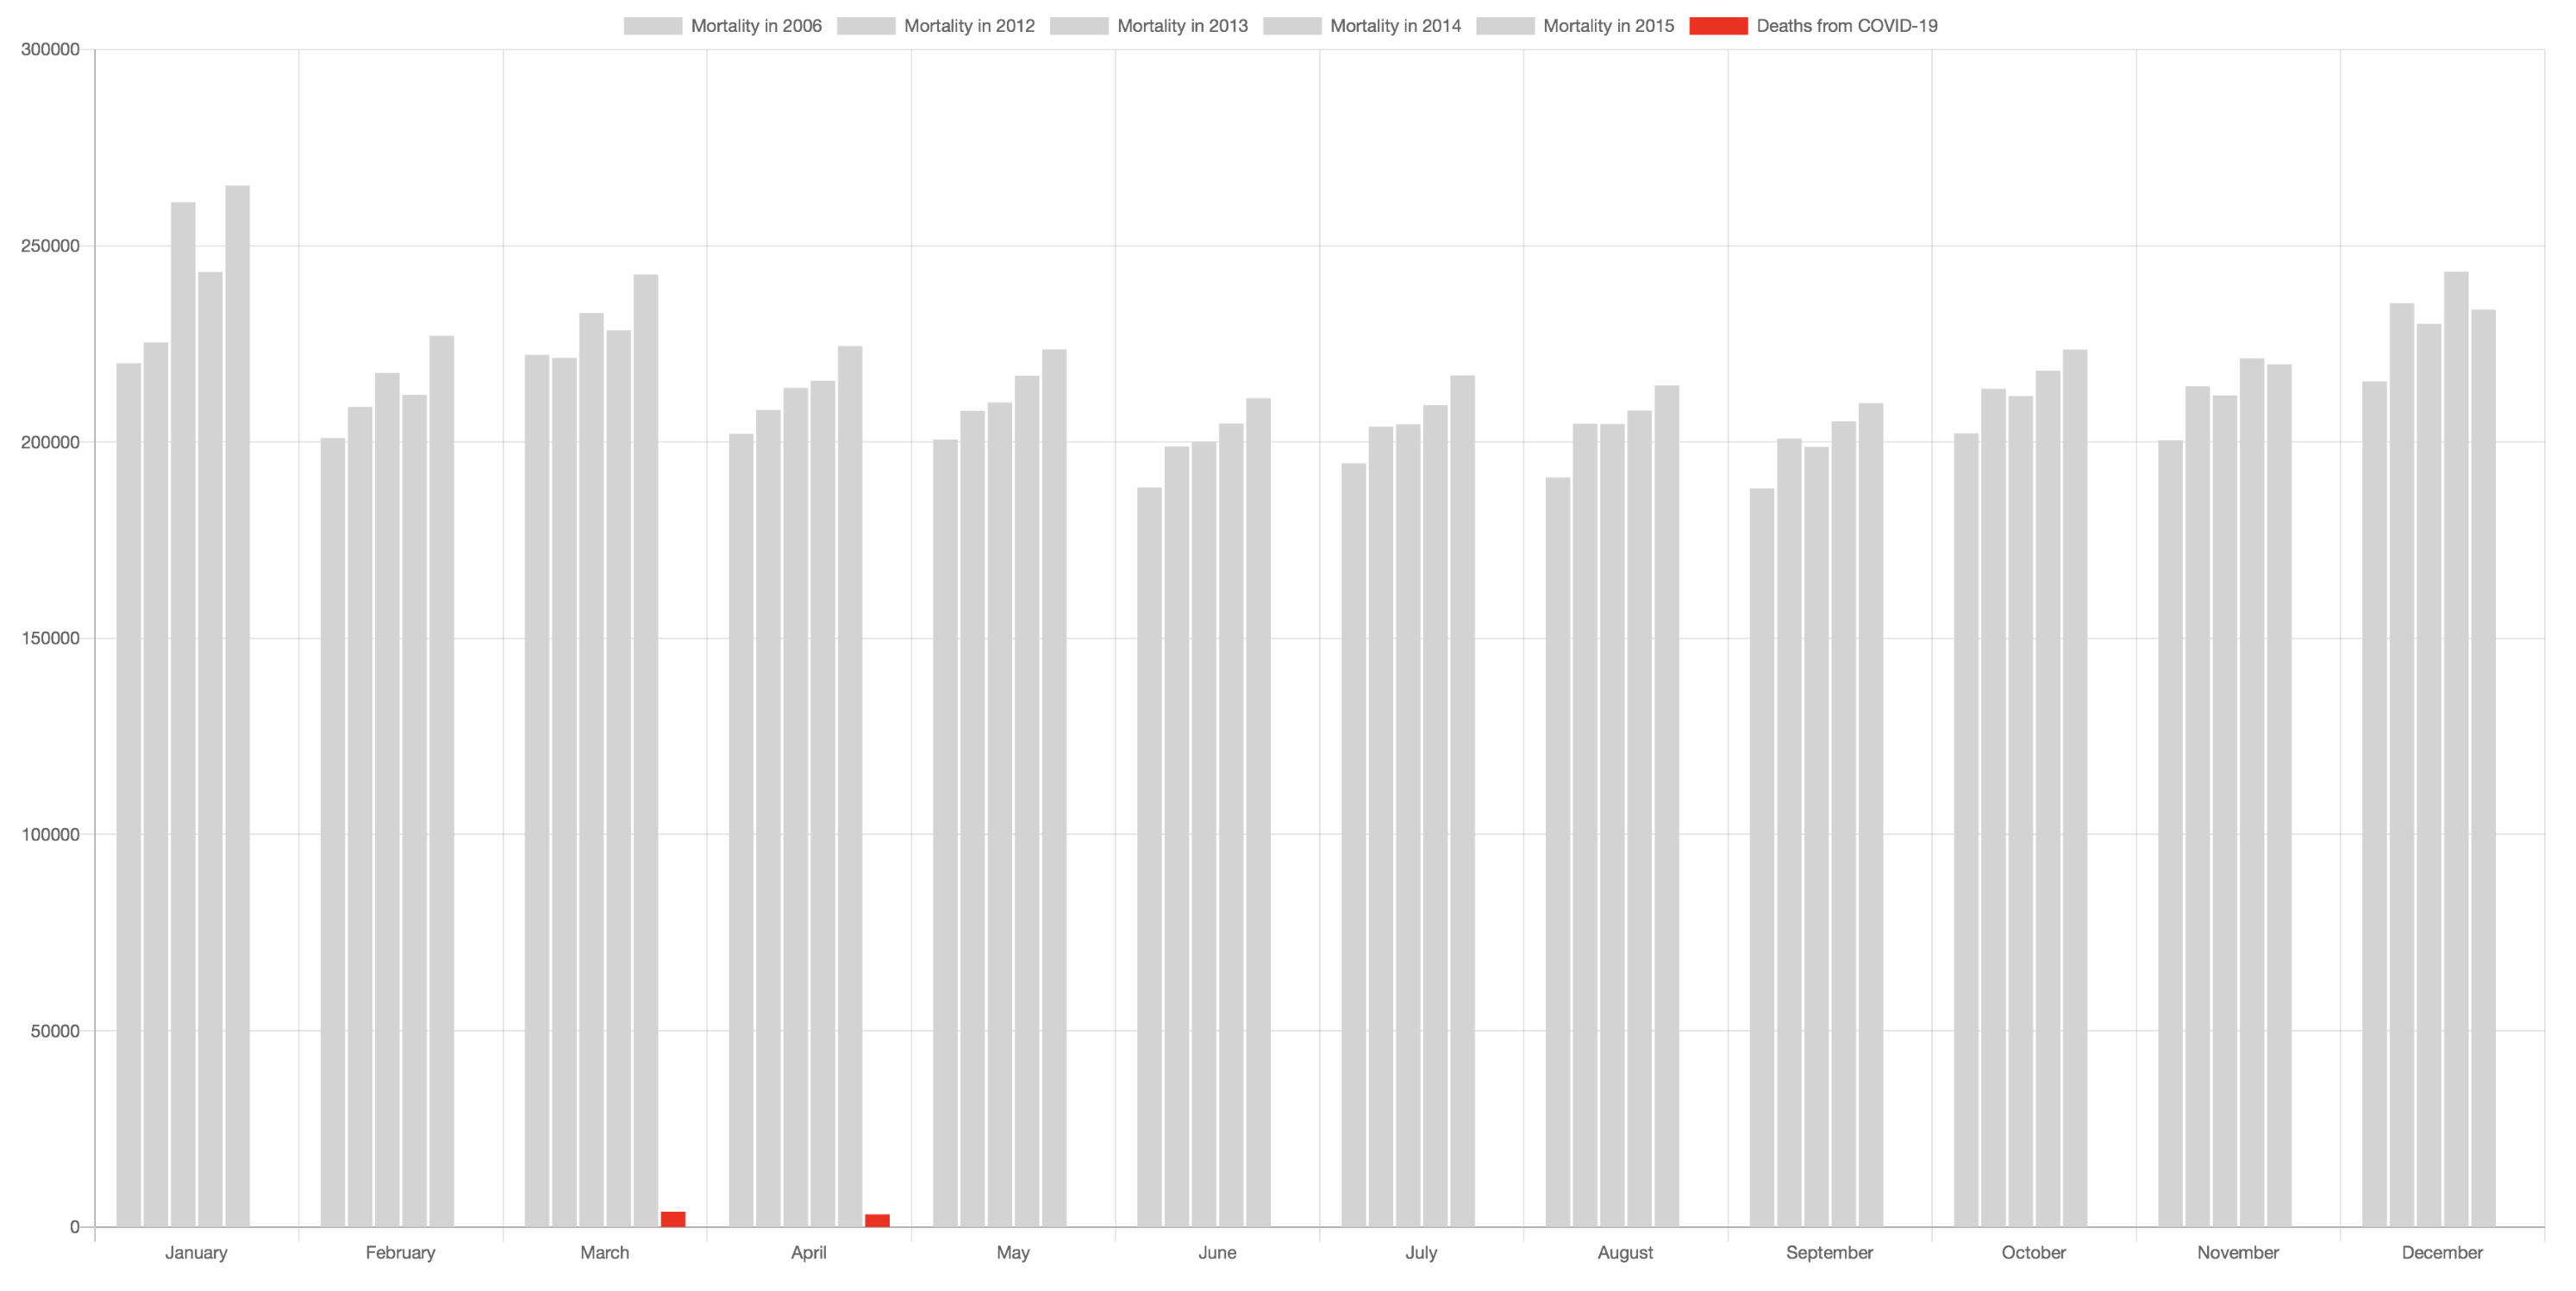
- Monthly mortality rates for the previous years compared with COVID-19
- Current weekly death rates
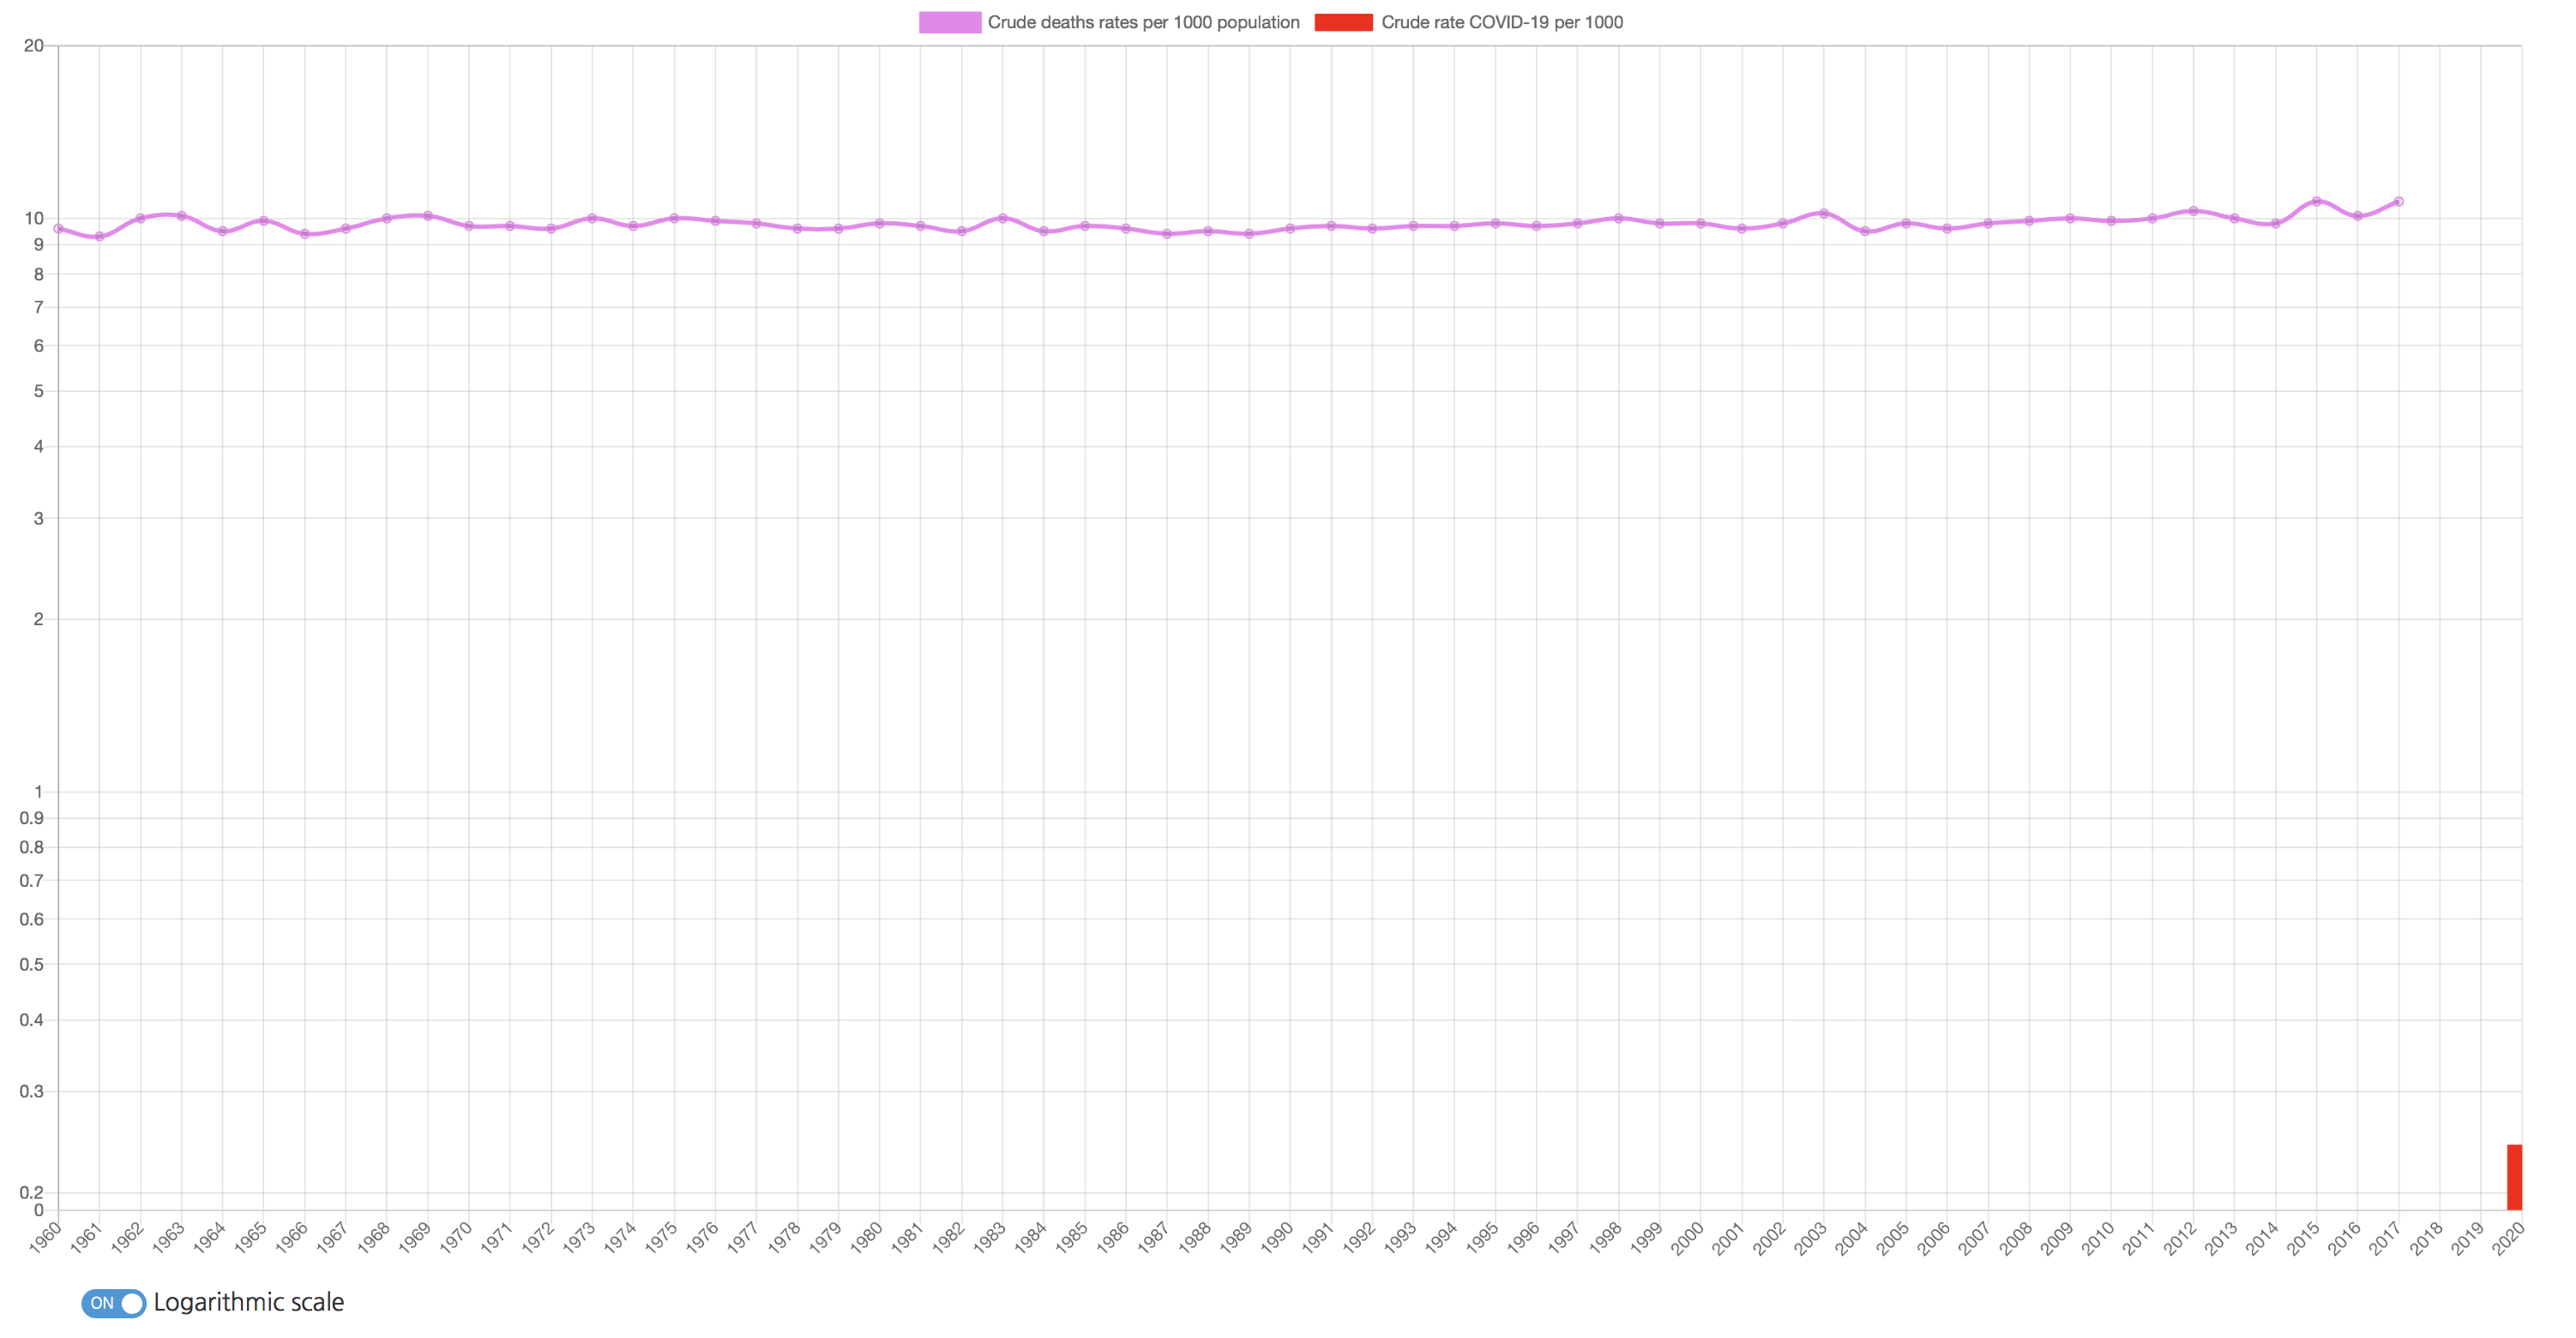
- Crude death rates vs COVID-19
See, for example Crude rates for Spain and other country-level pages.
April 2, 2020
An article ‘Observing Coronavirus Pandemic with Raku’ covering some of the internals of the website published on perl.com.
March 31, 2020
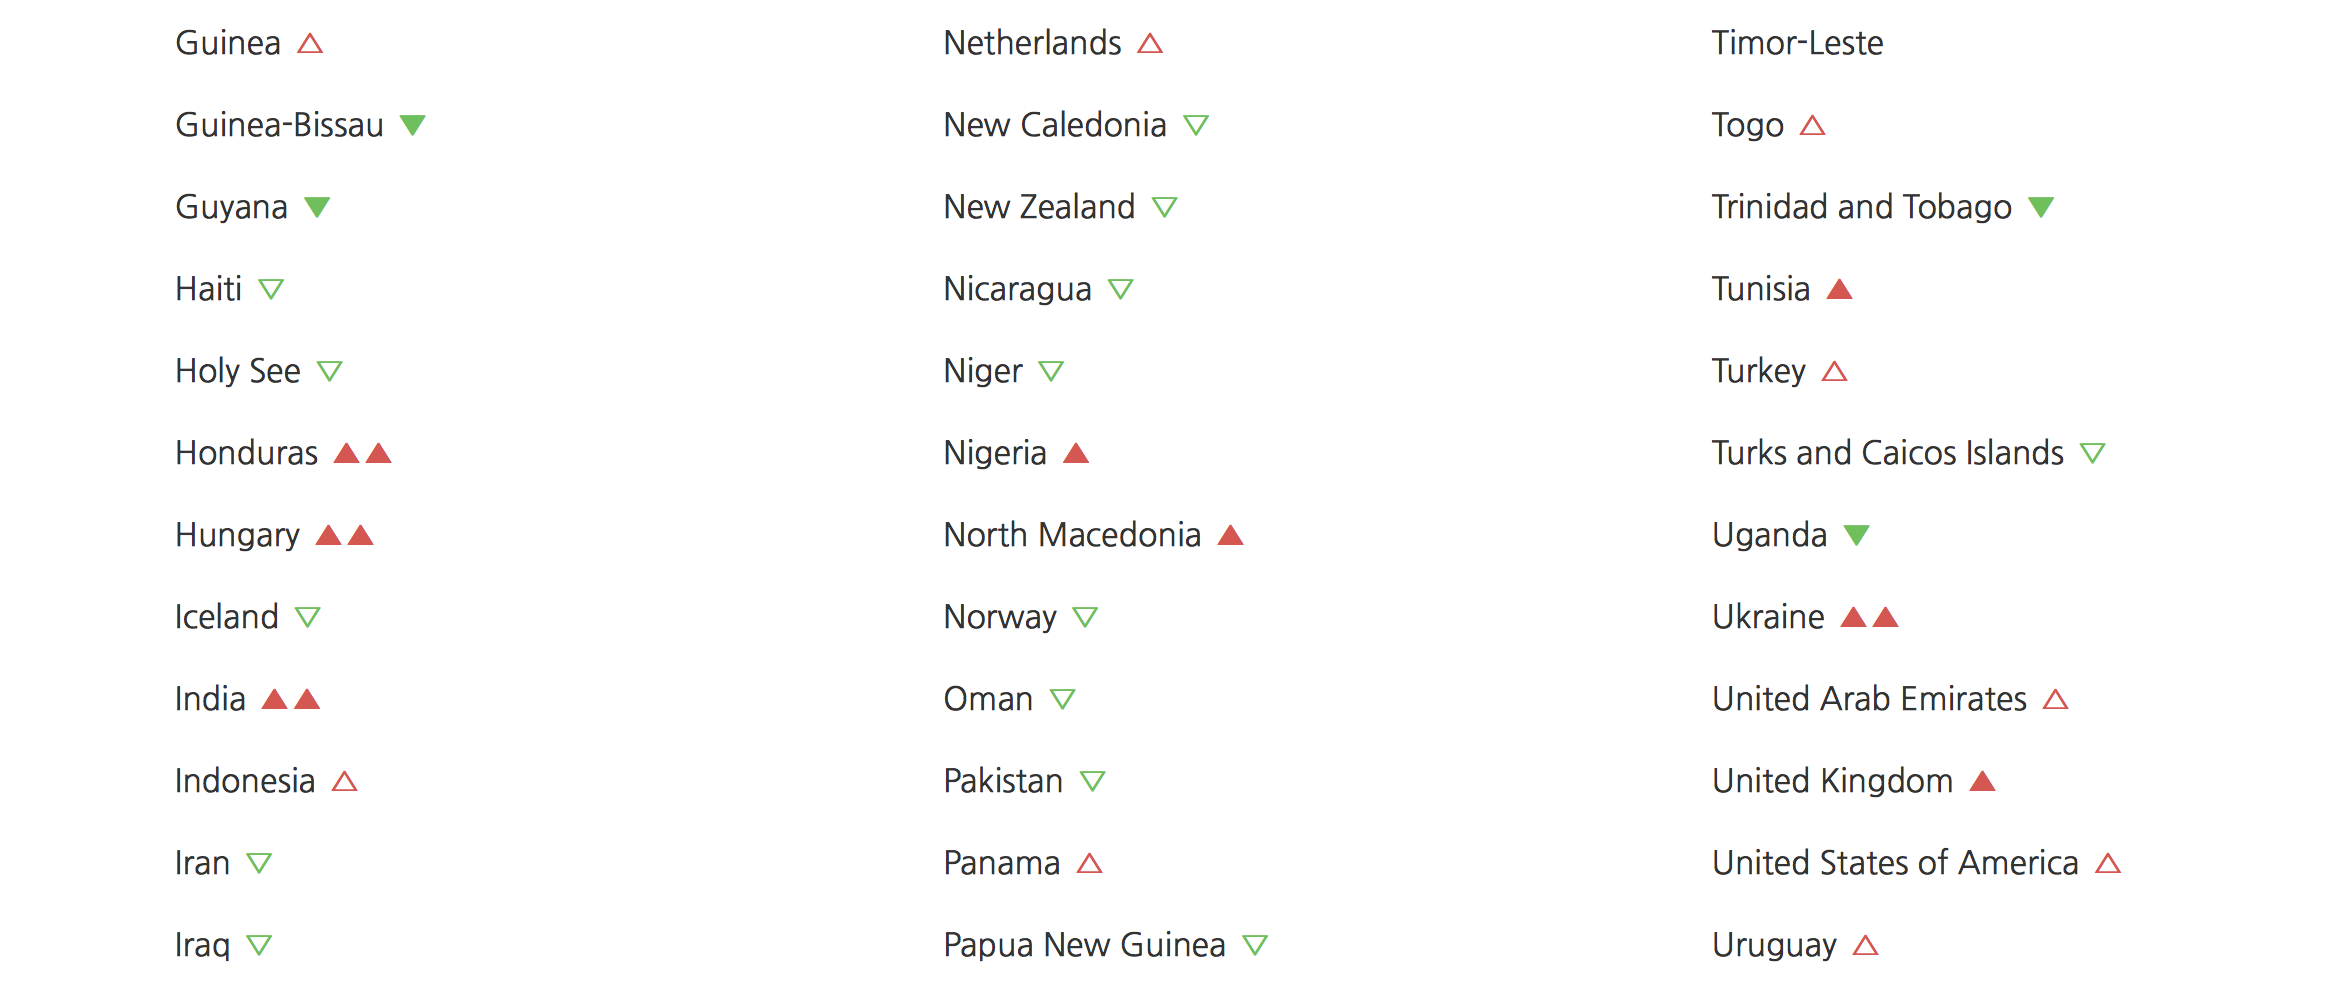
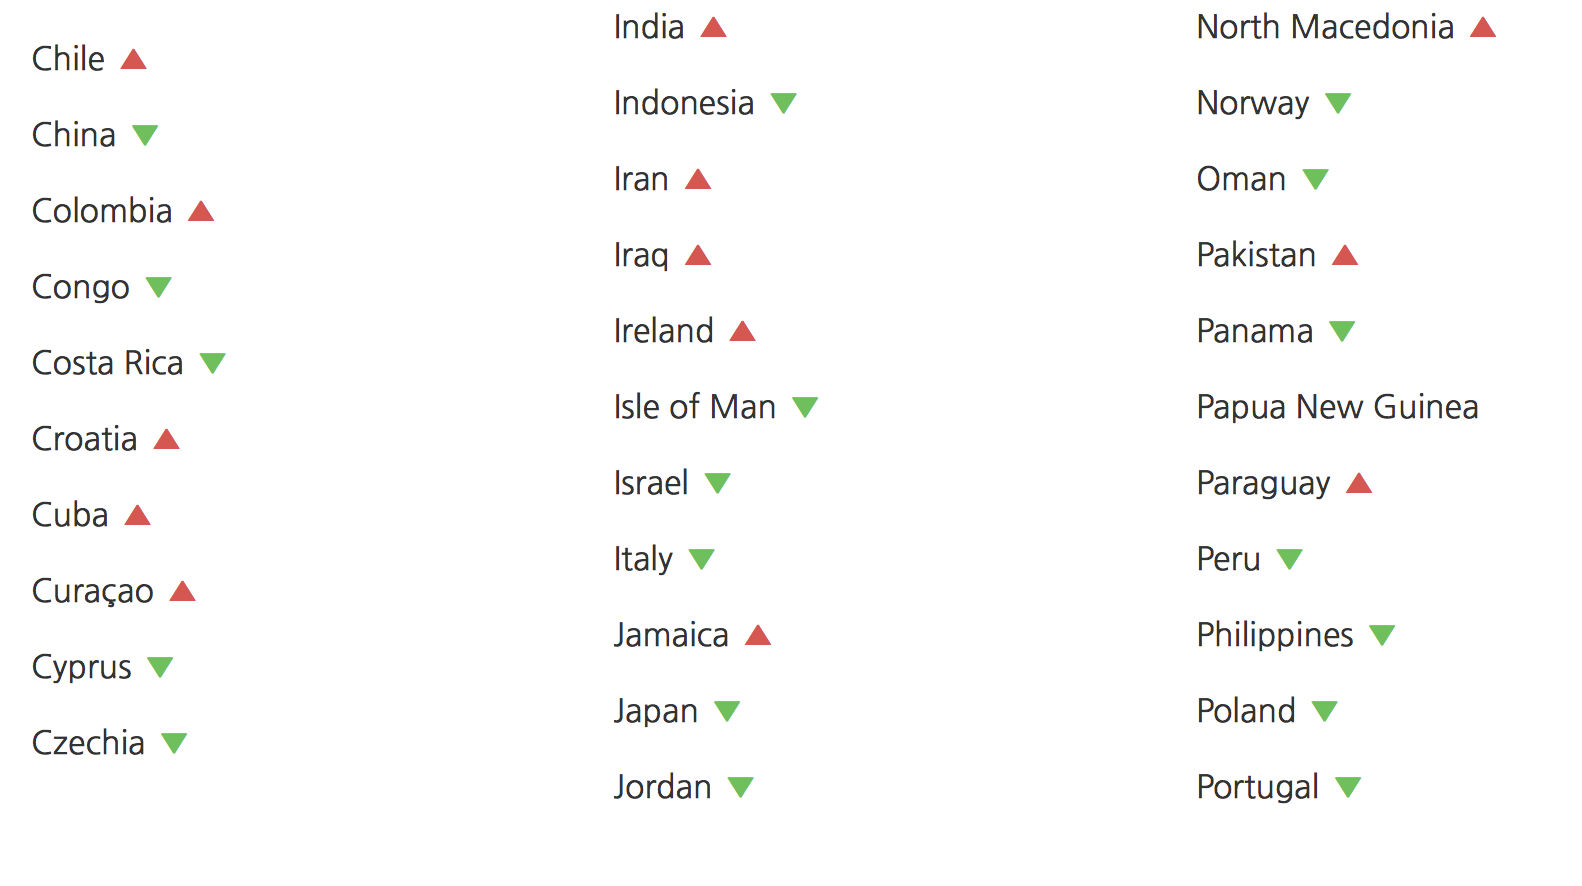
The ’stock market arrows‘ have been added to the list of countries. You can now immediately see if the country is recovering. One of a few cases when the down arrow can be green and that‘s good. Also available for the US states and China provinces.
March 29, 2020
A blog post ‘On computing the number of recoveries’ published in the Tech blog.
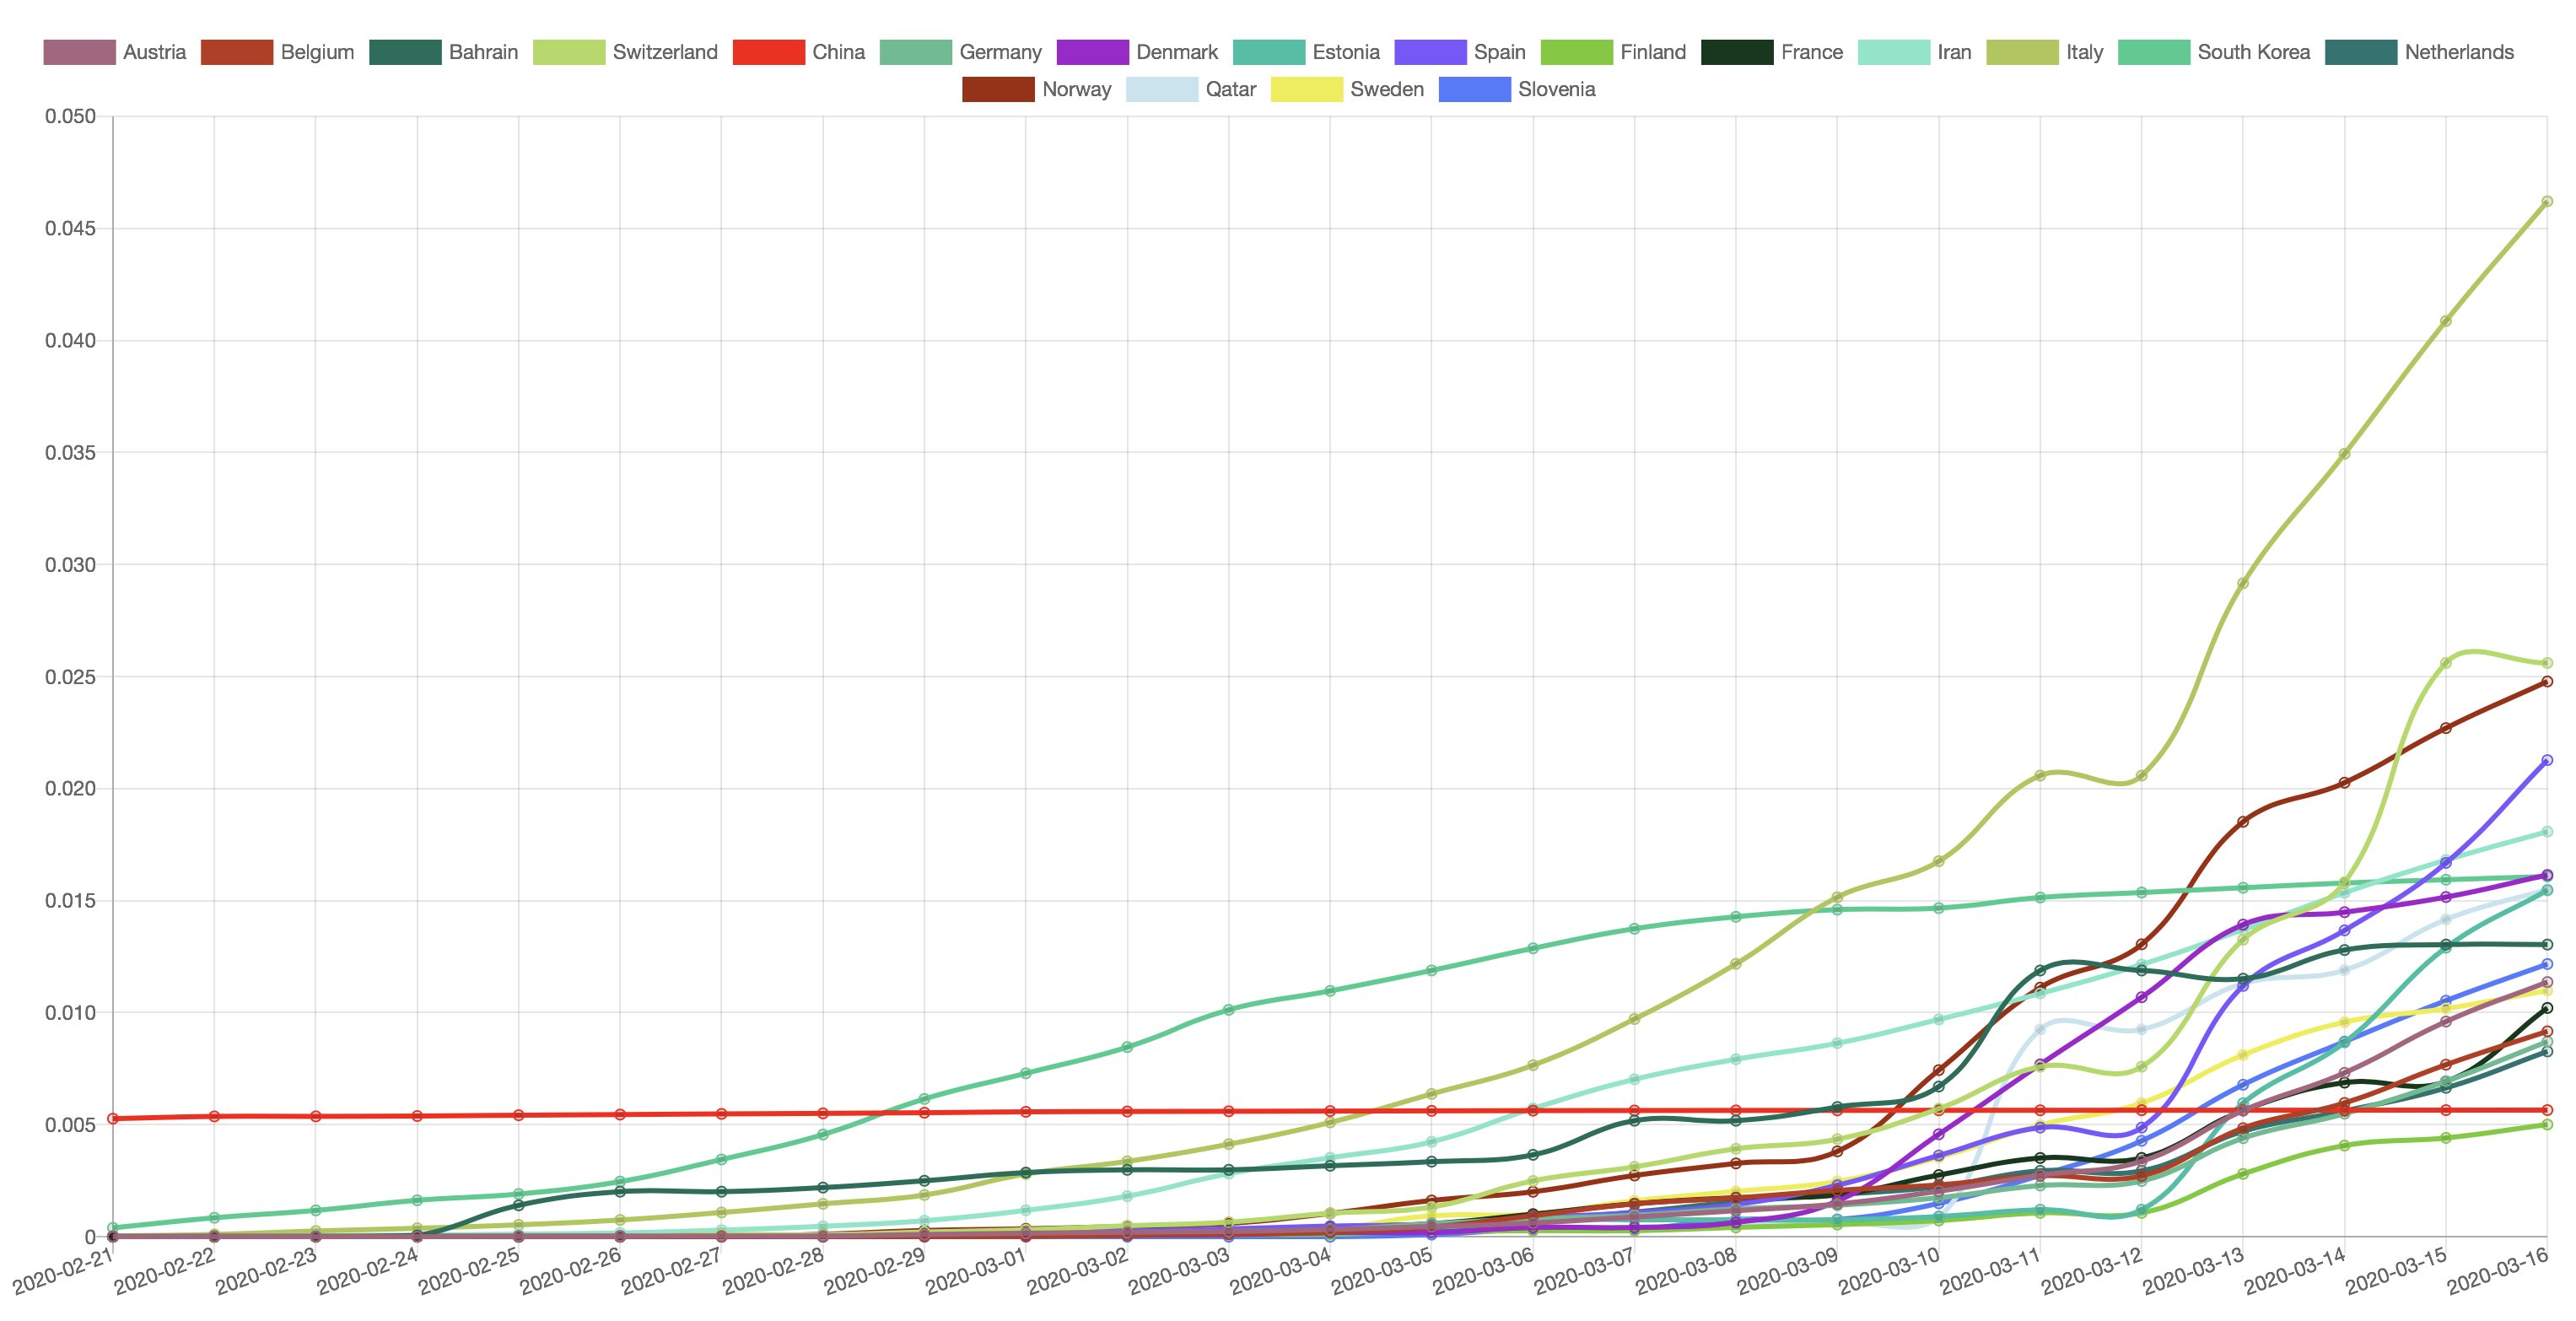
The graph comparing per capita cases in different countries is more visible now in the site structure. Also, it now comes together with a co-graph sorted by failures per capita.
March 25, 2020
New features:
- World overview
- Table views for the data of the World, every country, region, and continent
March 22, 2020
New pages and features:
- World excluding China
- China provinces and regions
- China excluding Hubei
- Raw numbers of the confirmed, failed, recovered, and active cases on all levels: World, continents, contries, regions
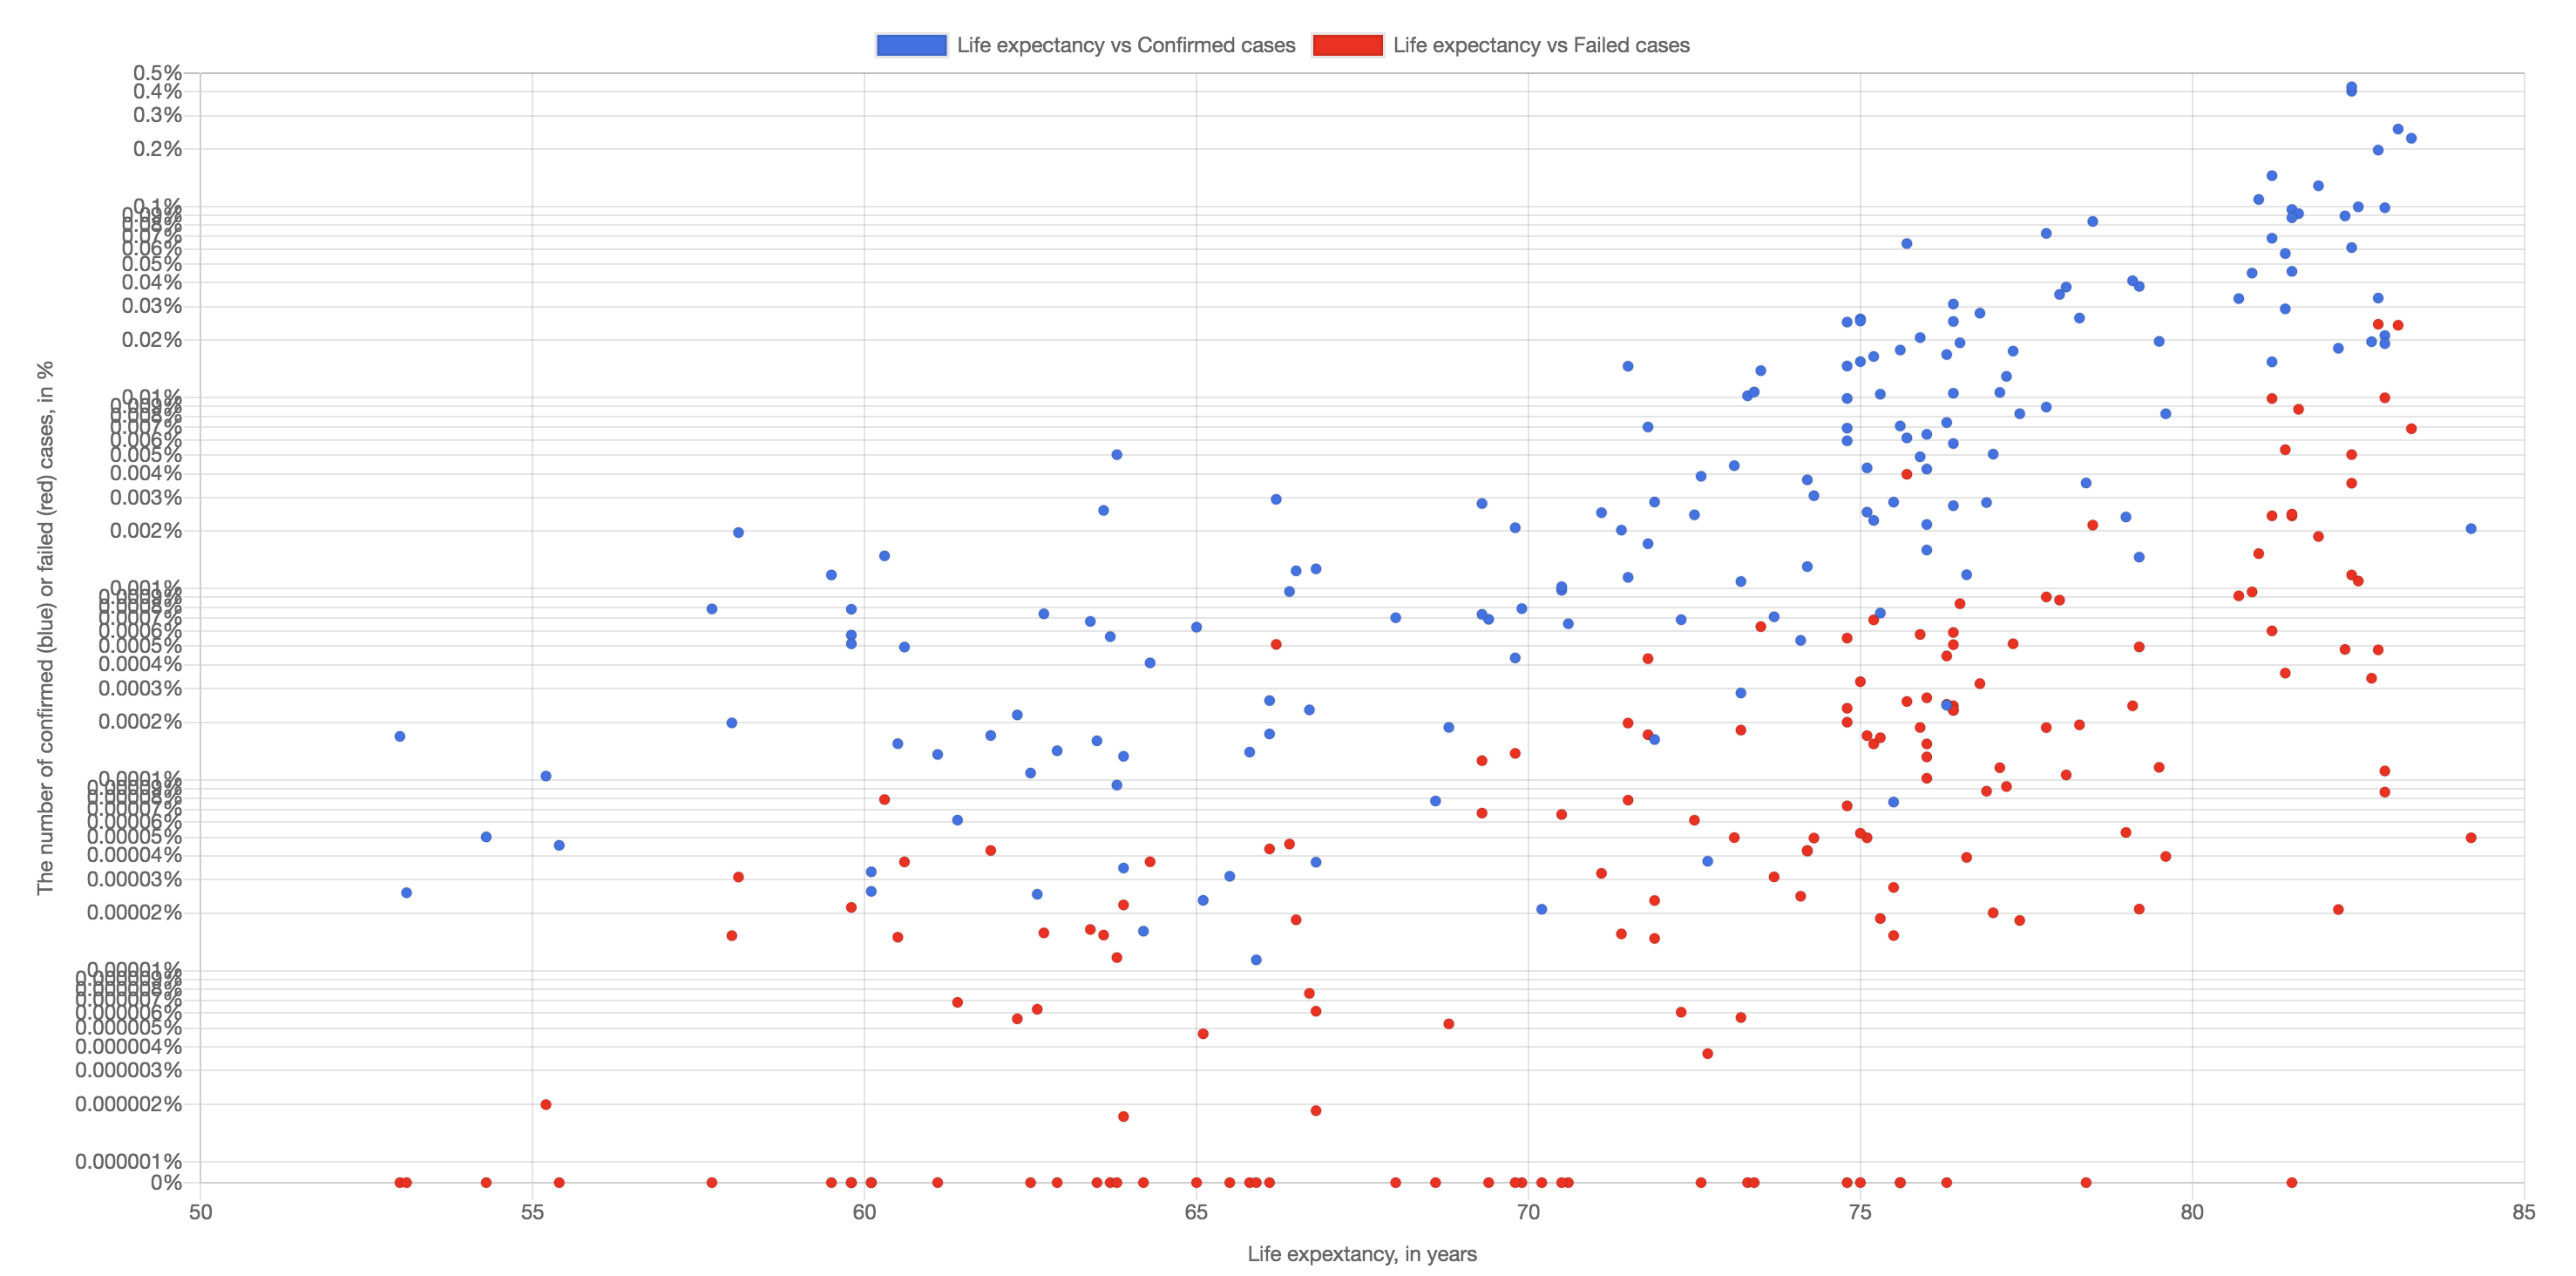
- Cases vs life expectancy on the graph
Using the logarithmic scale switches, you can see the details of all charts. For example, you can notice that China numbers outside of Hubei are growing, e.g., in Beijing. See also: Daily speed in China.

March 21, 2020
New data blocks:
- The most recent World raw numbers
- The graphs with the number of new cases per day for the World, continents, countries, and regions
March 19, 2020
A new graph comparing the number of active cases per continent. Notably, Eurasia, being a single continent, suffers most.
And some new pages with the stats per continent.
March 18, 2020
A couple of updates:
March 17, 2020
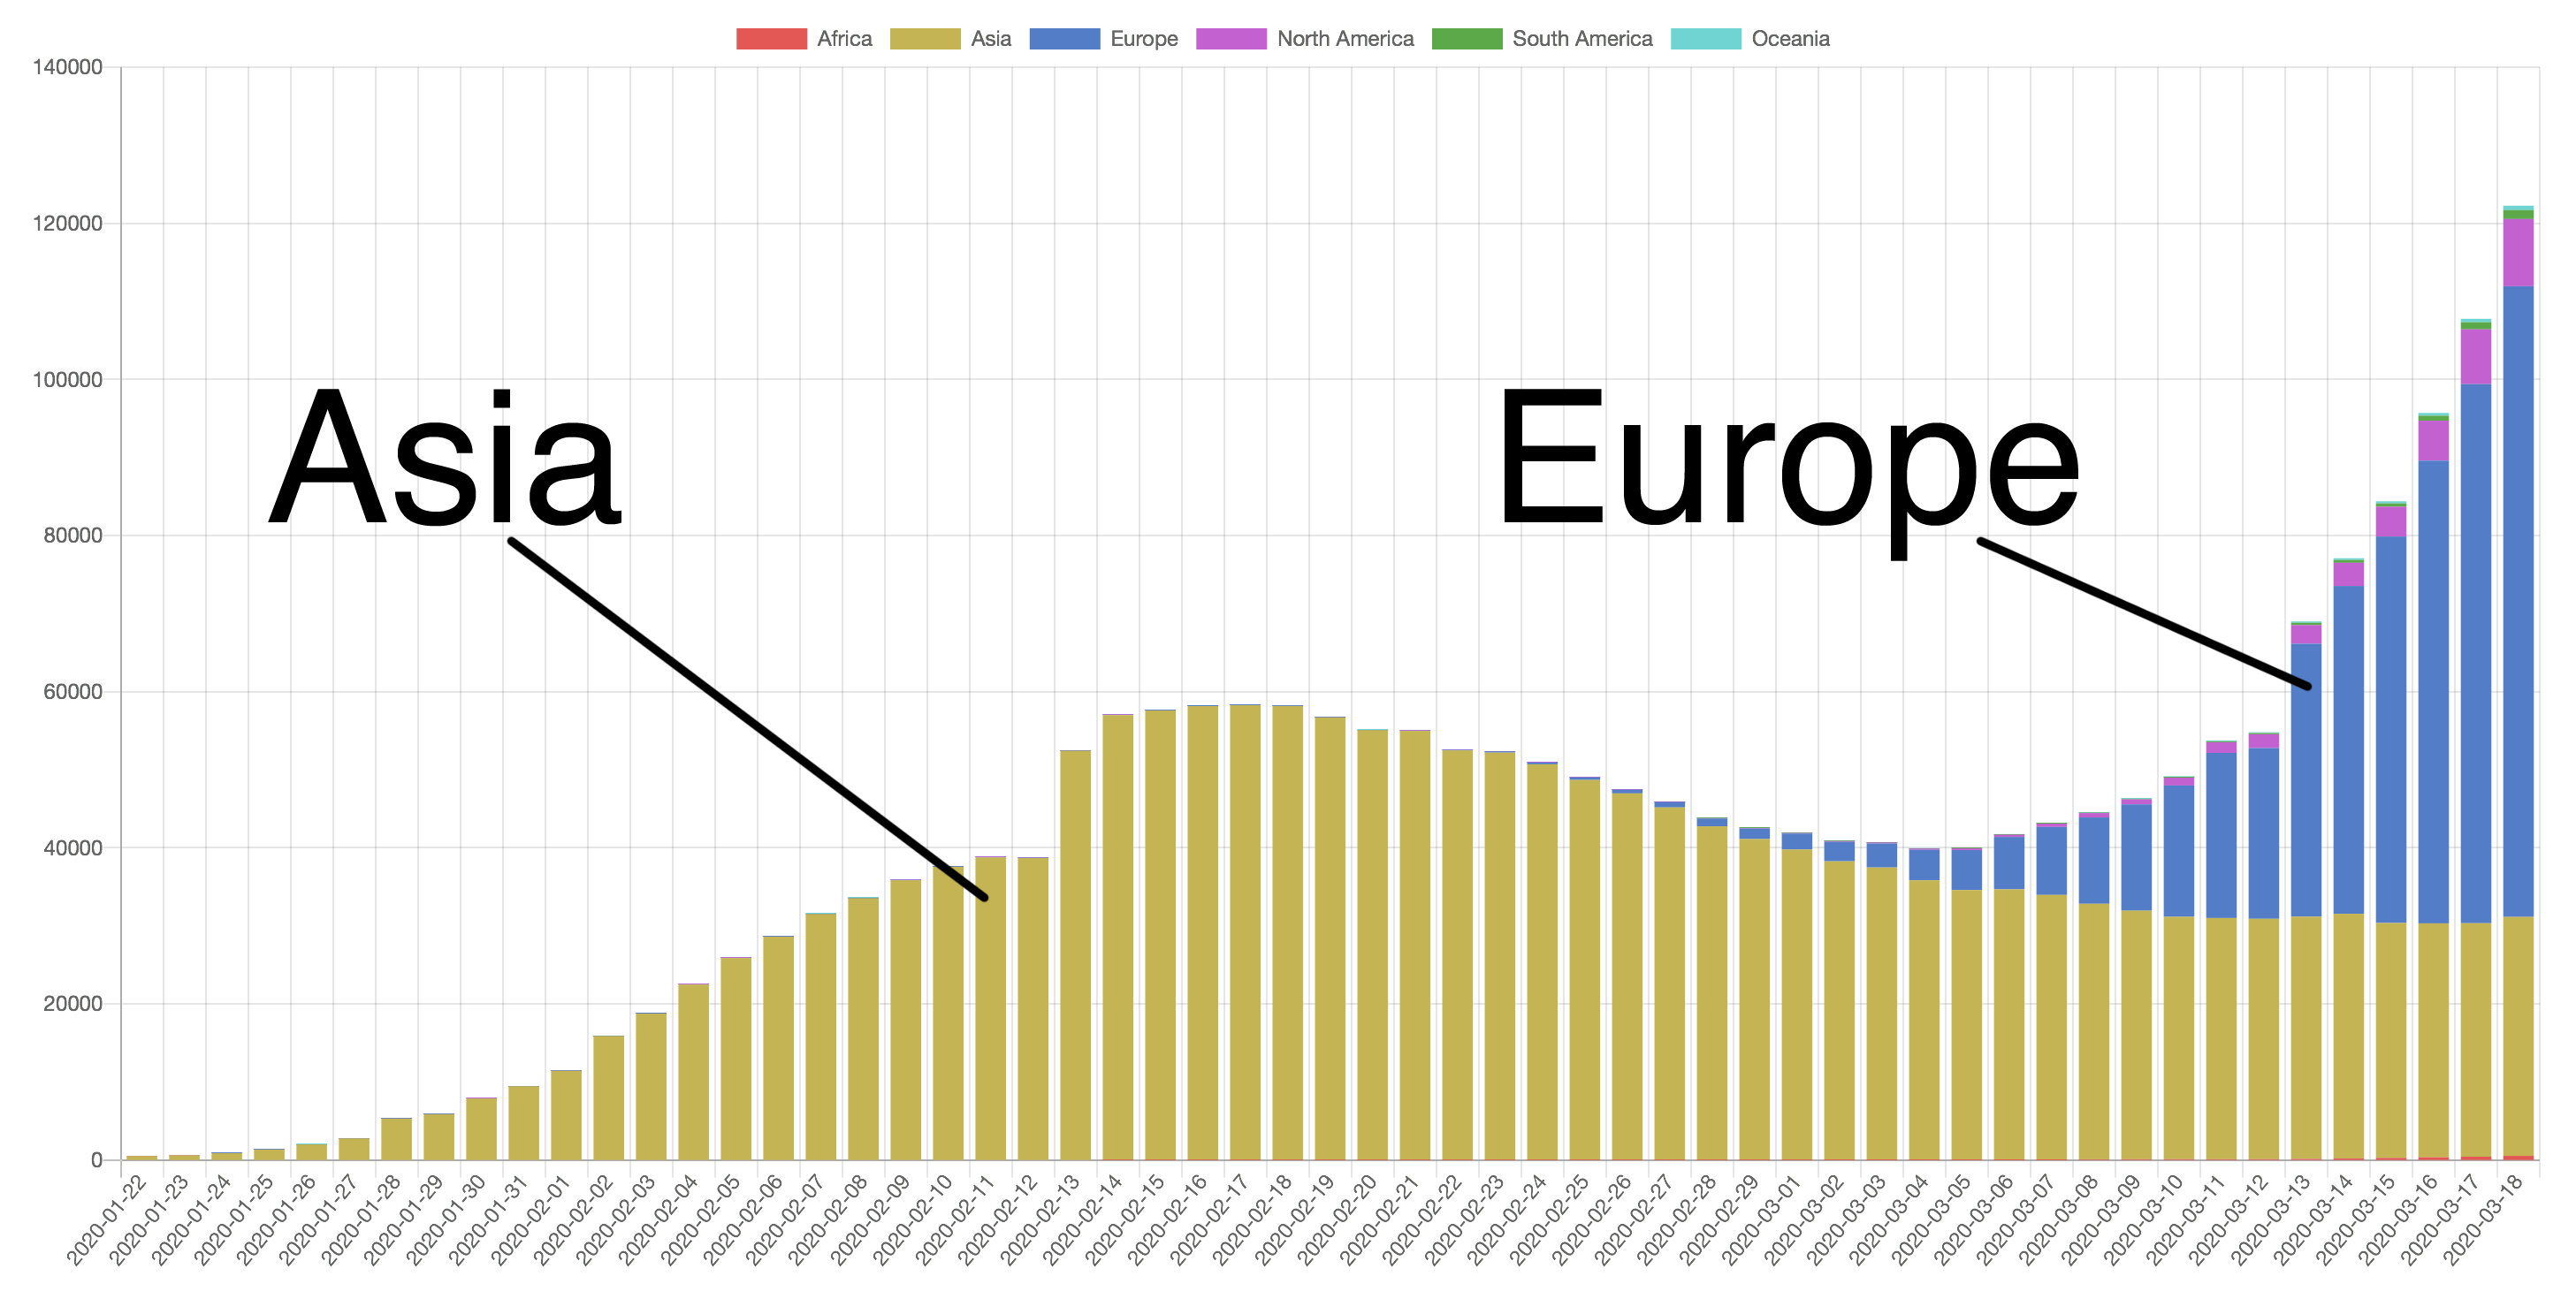
New graph: how (currently mostly European) countries overpass China by the number of confirmed infected population.
March 16, 2020
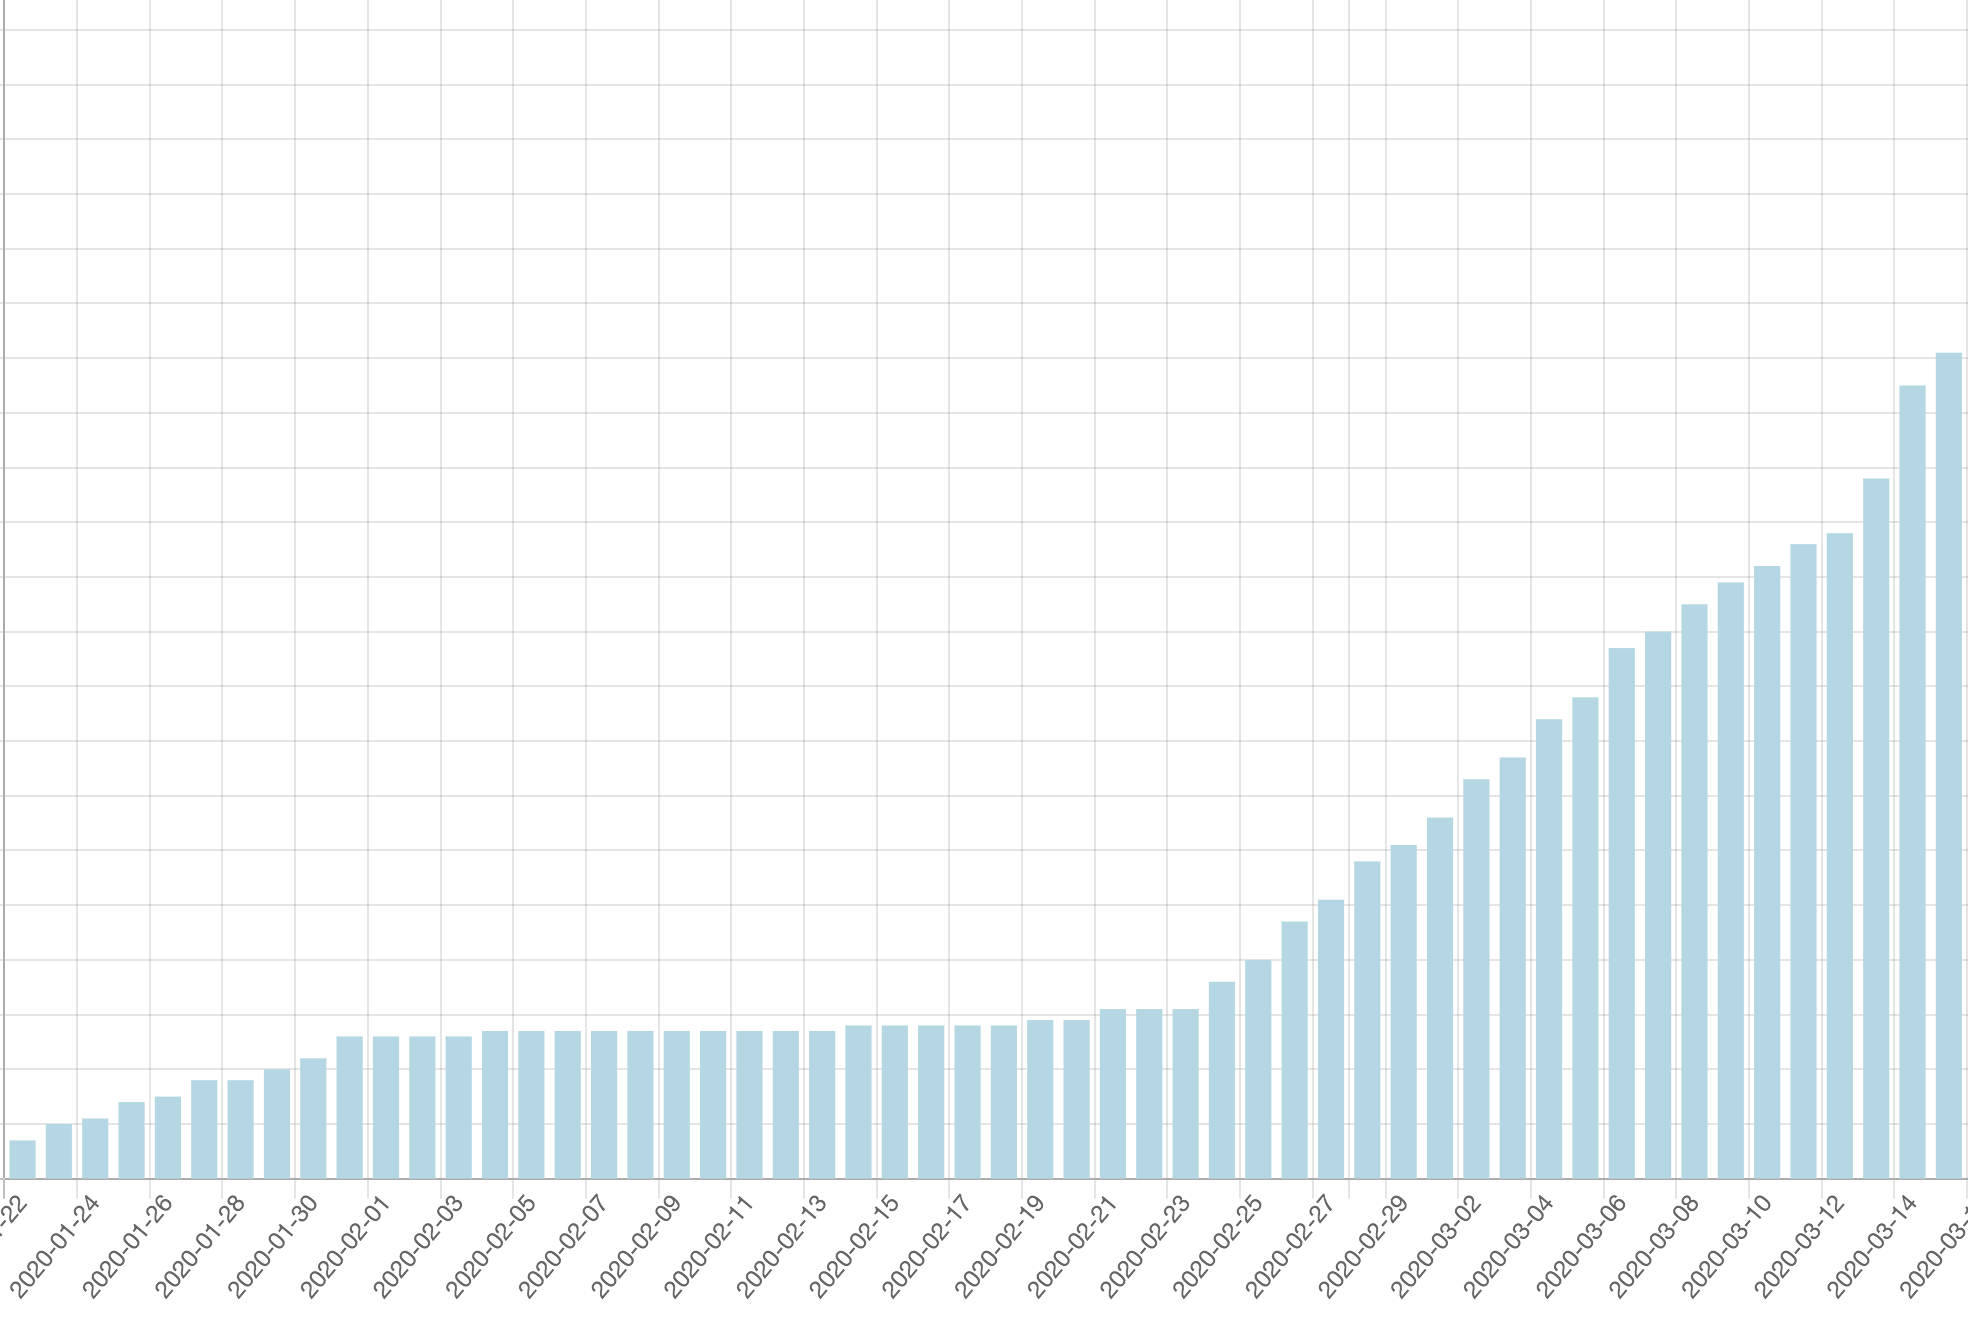
A new graph with the number of affected countries published.
You can also see there which country appeared on the given date in this Coronavirus story. Central African Republic, Equatorial Guinea, and Uzbekistan entered the chart yesterday with 1 confirmed cases in each.
March 14, 2020
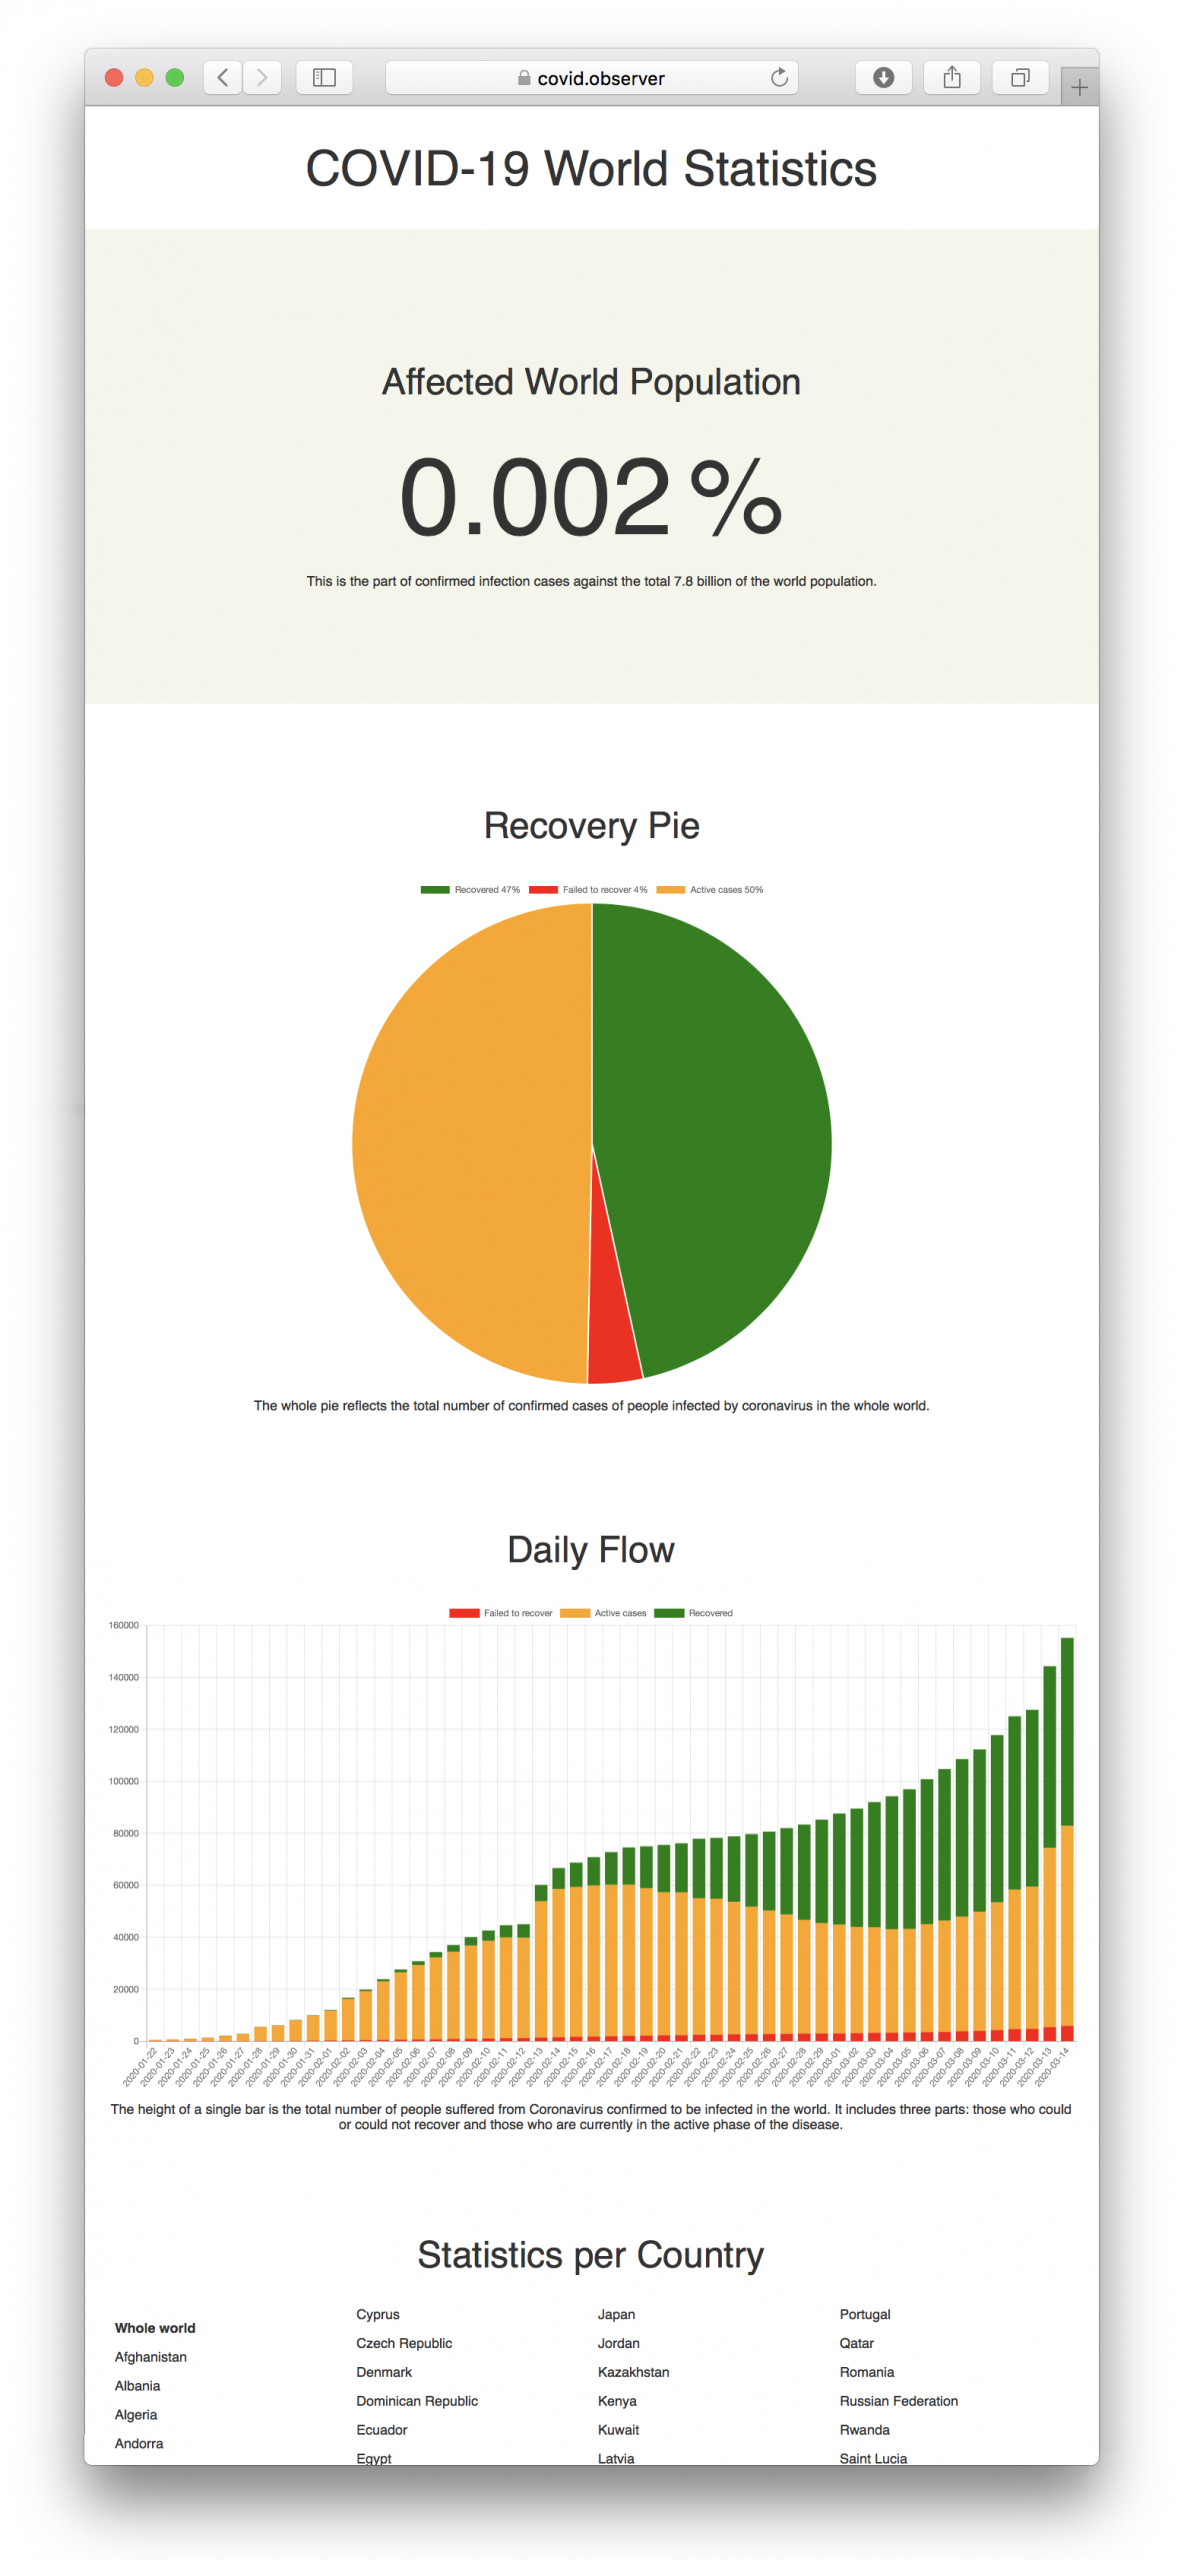
Website covid.observer launched. Read what this is about.